This workshop will provide a preliminary introduction to geographic information systems (GIS) and spatial methods for analyzing and designing urban spaces. Methods will be introduced as we examine the current conditions, and speculate on the futures of commercial spaces in New York City through publicly available data.
Many of the factors influencing commercial spaces in NYC are spatial: retail corridors in primarily business districts are struggling more than those adjacent to residential neighborhoods during the pandemic; new open streets are not evenly distributed; e-commerce distribution sites are rented in locations that have been carefully calibrated to optimize delivery efficiencies.
Maps and geographic analysis are key tools for interpreting the built and social characteristics of cities– highly relevant for understanding commercial spaces today. Thoughtful uses of spatial data expose invisible patterns, and can change the way we see and engage with our world. However, maps are never just representations, they are always active in shaping the worlds they describe. With this in mind, the workshop will introduce approaches to gathering, visualizing, and interpreting spatial data as a starting point in the design process.
- Requirements
- Resources
- Retail site analysis: getting started
- Adding data
- Creating a spatial dataset from xy coordinates
- Defining a site area
- Viewing attribute data
- Defining layer symbology
- Uncovering patterns in businesses
- Exporting
Requirements
For 6/18 please complete this tutorial to familiarize yourself with basics of loading, creating, and visualizing data in QGIS and designing a site map composition.
After completing this tutorial draw on these datasets and methods to design a site analysis map relevant to the beginning of your studio project.
We will begin workshop 02 on June 18 with a pinup of:
- your Canal Street site analysis
- a site analysis drawing of a site (or sites) relevant to your studio project
- please post both documents here prior to the start of the workshop on 6/18
Resources
- This tutorial builds on and expects a basic familiarity with the concepts covered in these slides addressed during class
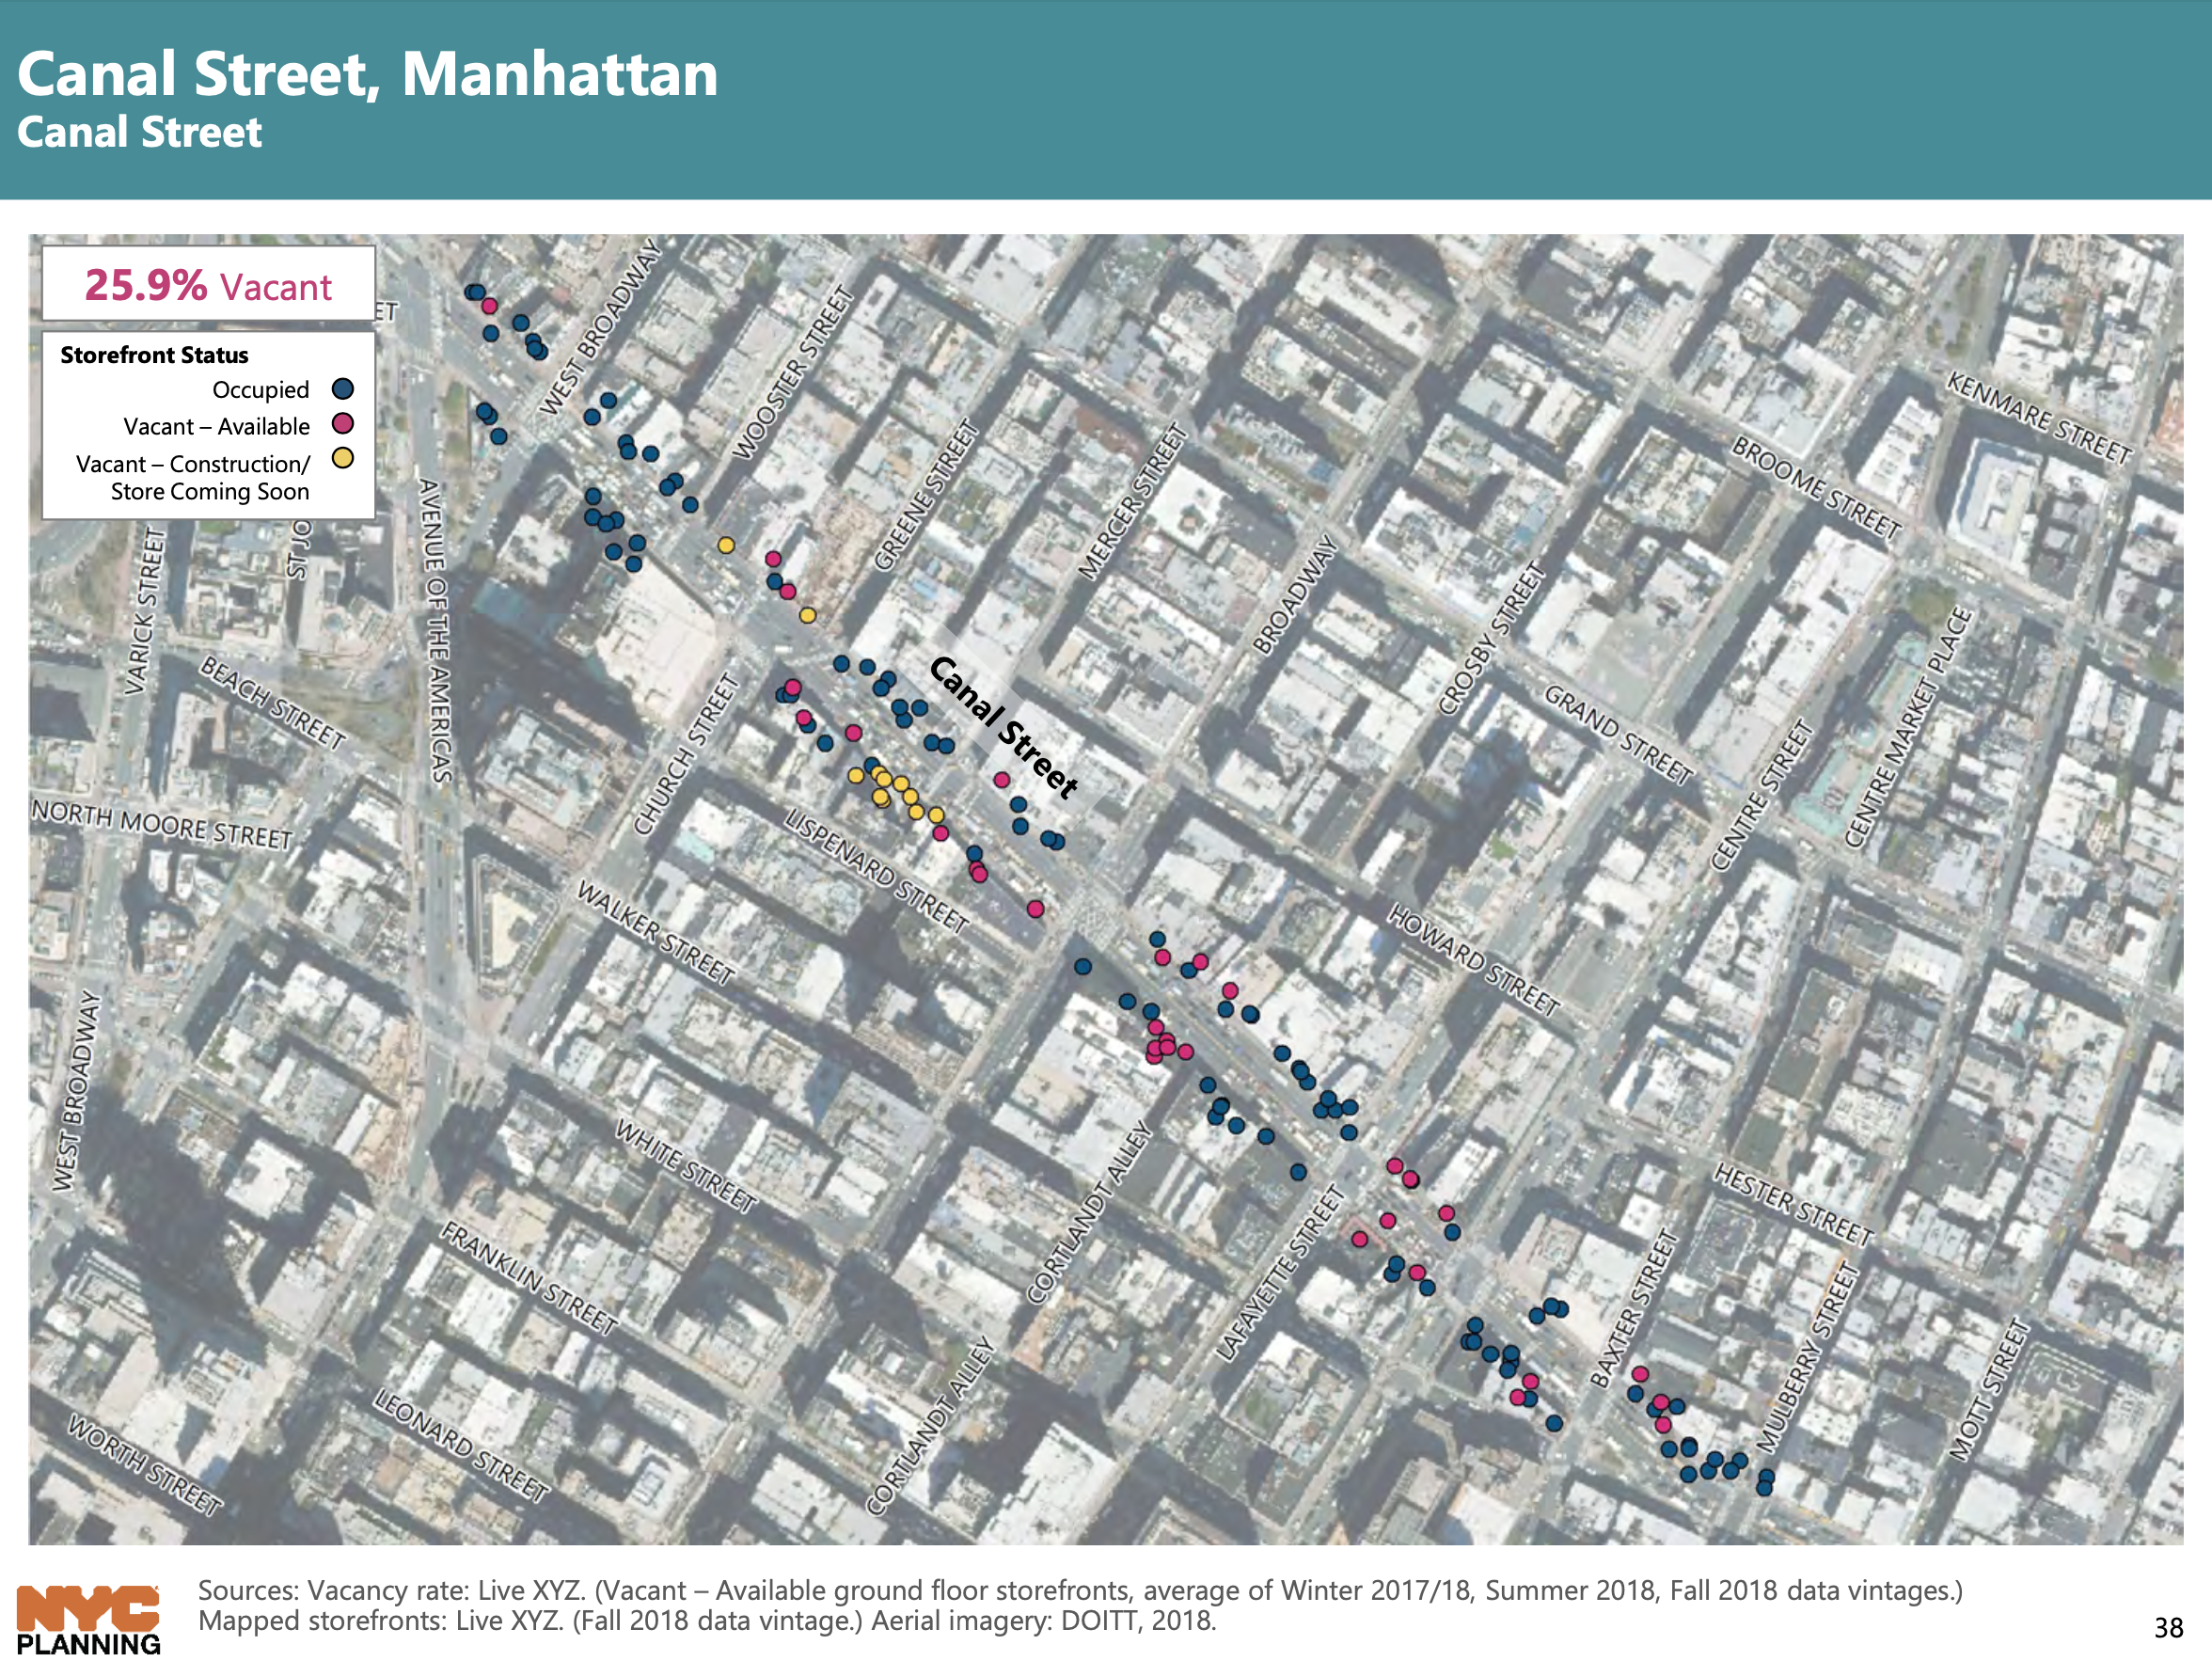
- Please refer back to this precedent project analysis as you approach designing your own site analysis map
Retail site analysis: getting started
This exercise is a hands on (& step by step) introduction to creating a site analysis drawing of a retail corridor using QGIS.
Through the exercise you will begin to develop familiarity with spatial data types, learn basic spatial analysis operations, develop workflows from QGIS to graphics and modeling softwares.
You will be creating a site analysis drawing using publicly available data from the City of New York as well as data on businesses and points of interest (poi) from a proprietary company (SafeGraph) that has made their data available for academic use. Familiarize yourself with the datasets you will be using – take a look at their metadata, who produced them, when they were most recently updated via the links below:
- NYC Building Footprints
- NYC Planimetric Data
- Point of Interest Data from SafeGraph
- Documentation & data dictionary
- please note this data is proprietary and was provided to the workshop under and academic use license. You may not use this data in any non-academic projects
- NYC Street Tree Census
Adding data
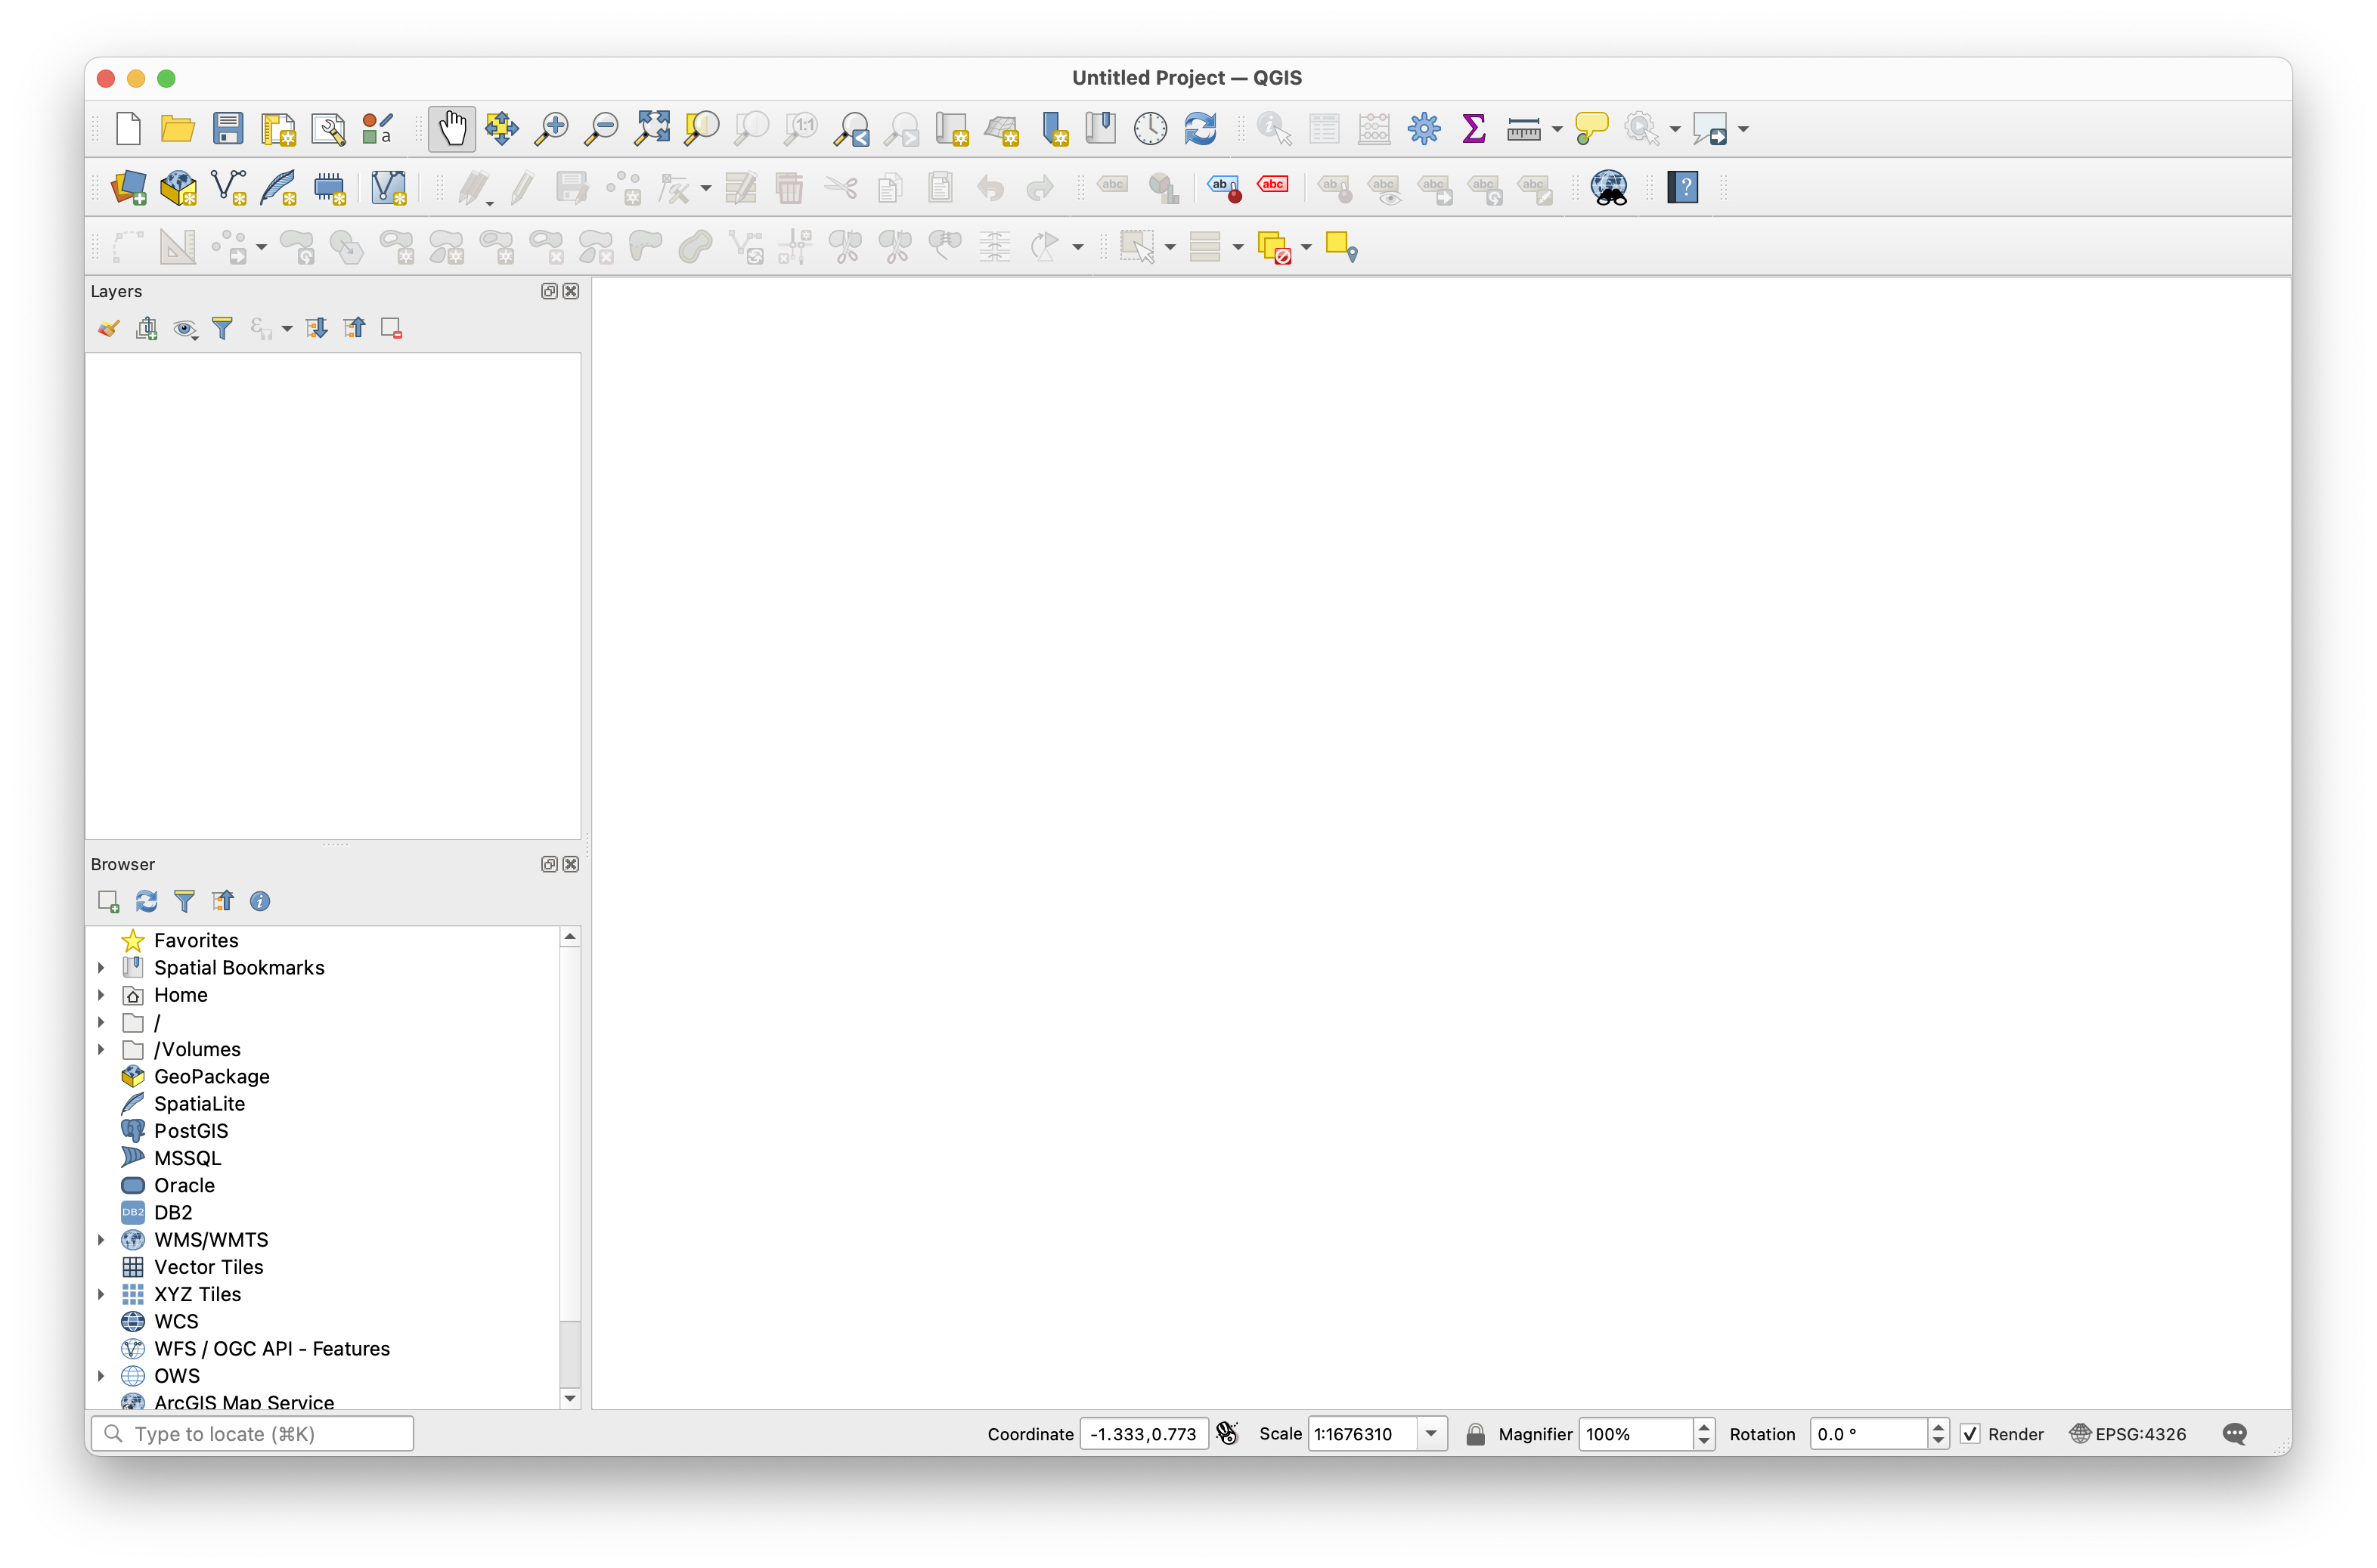
Open QGIS-LTR and create a new project
From the top menu bar select Layer and then Add Layer > Add Vector Layer.
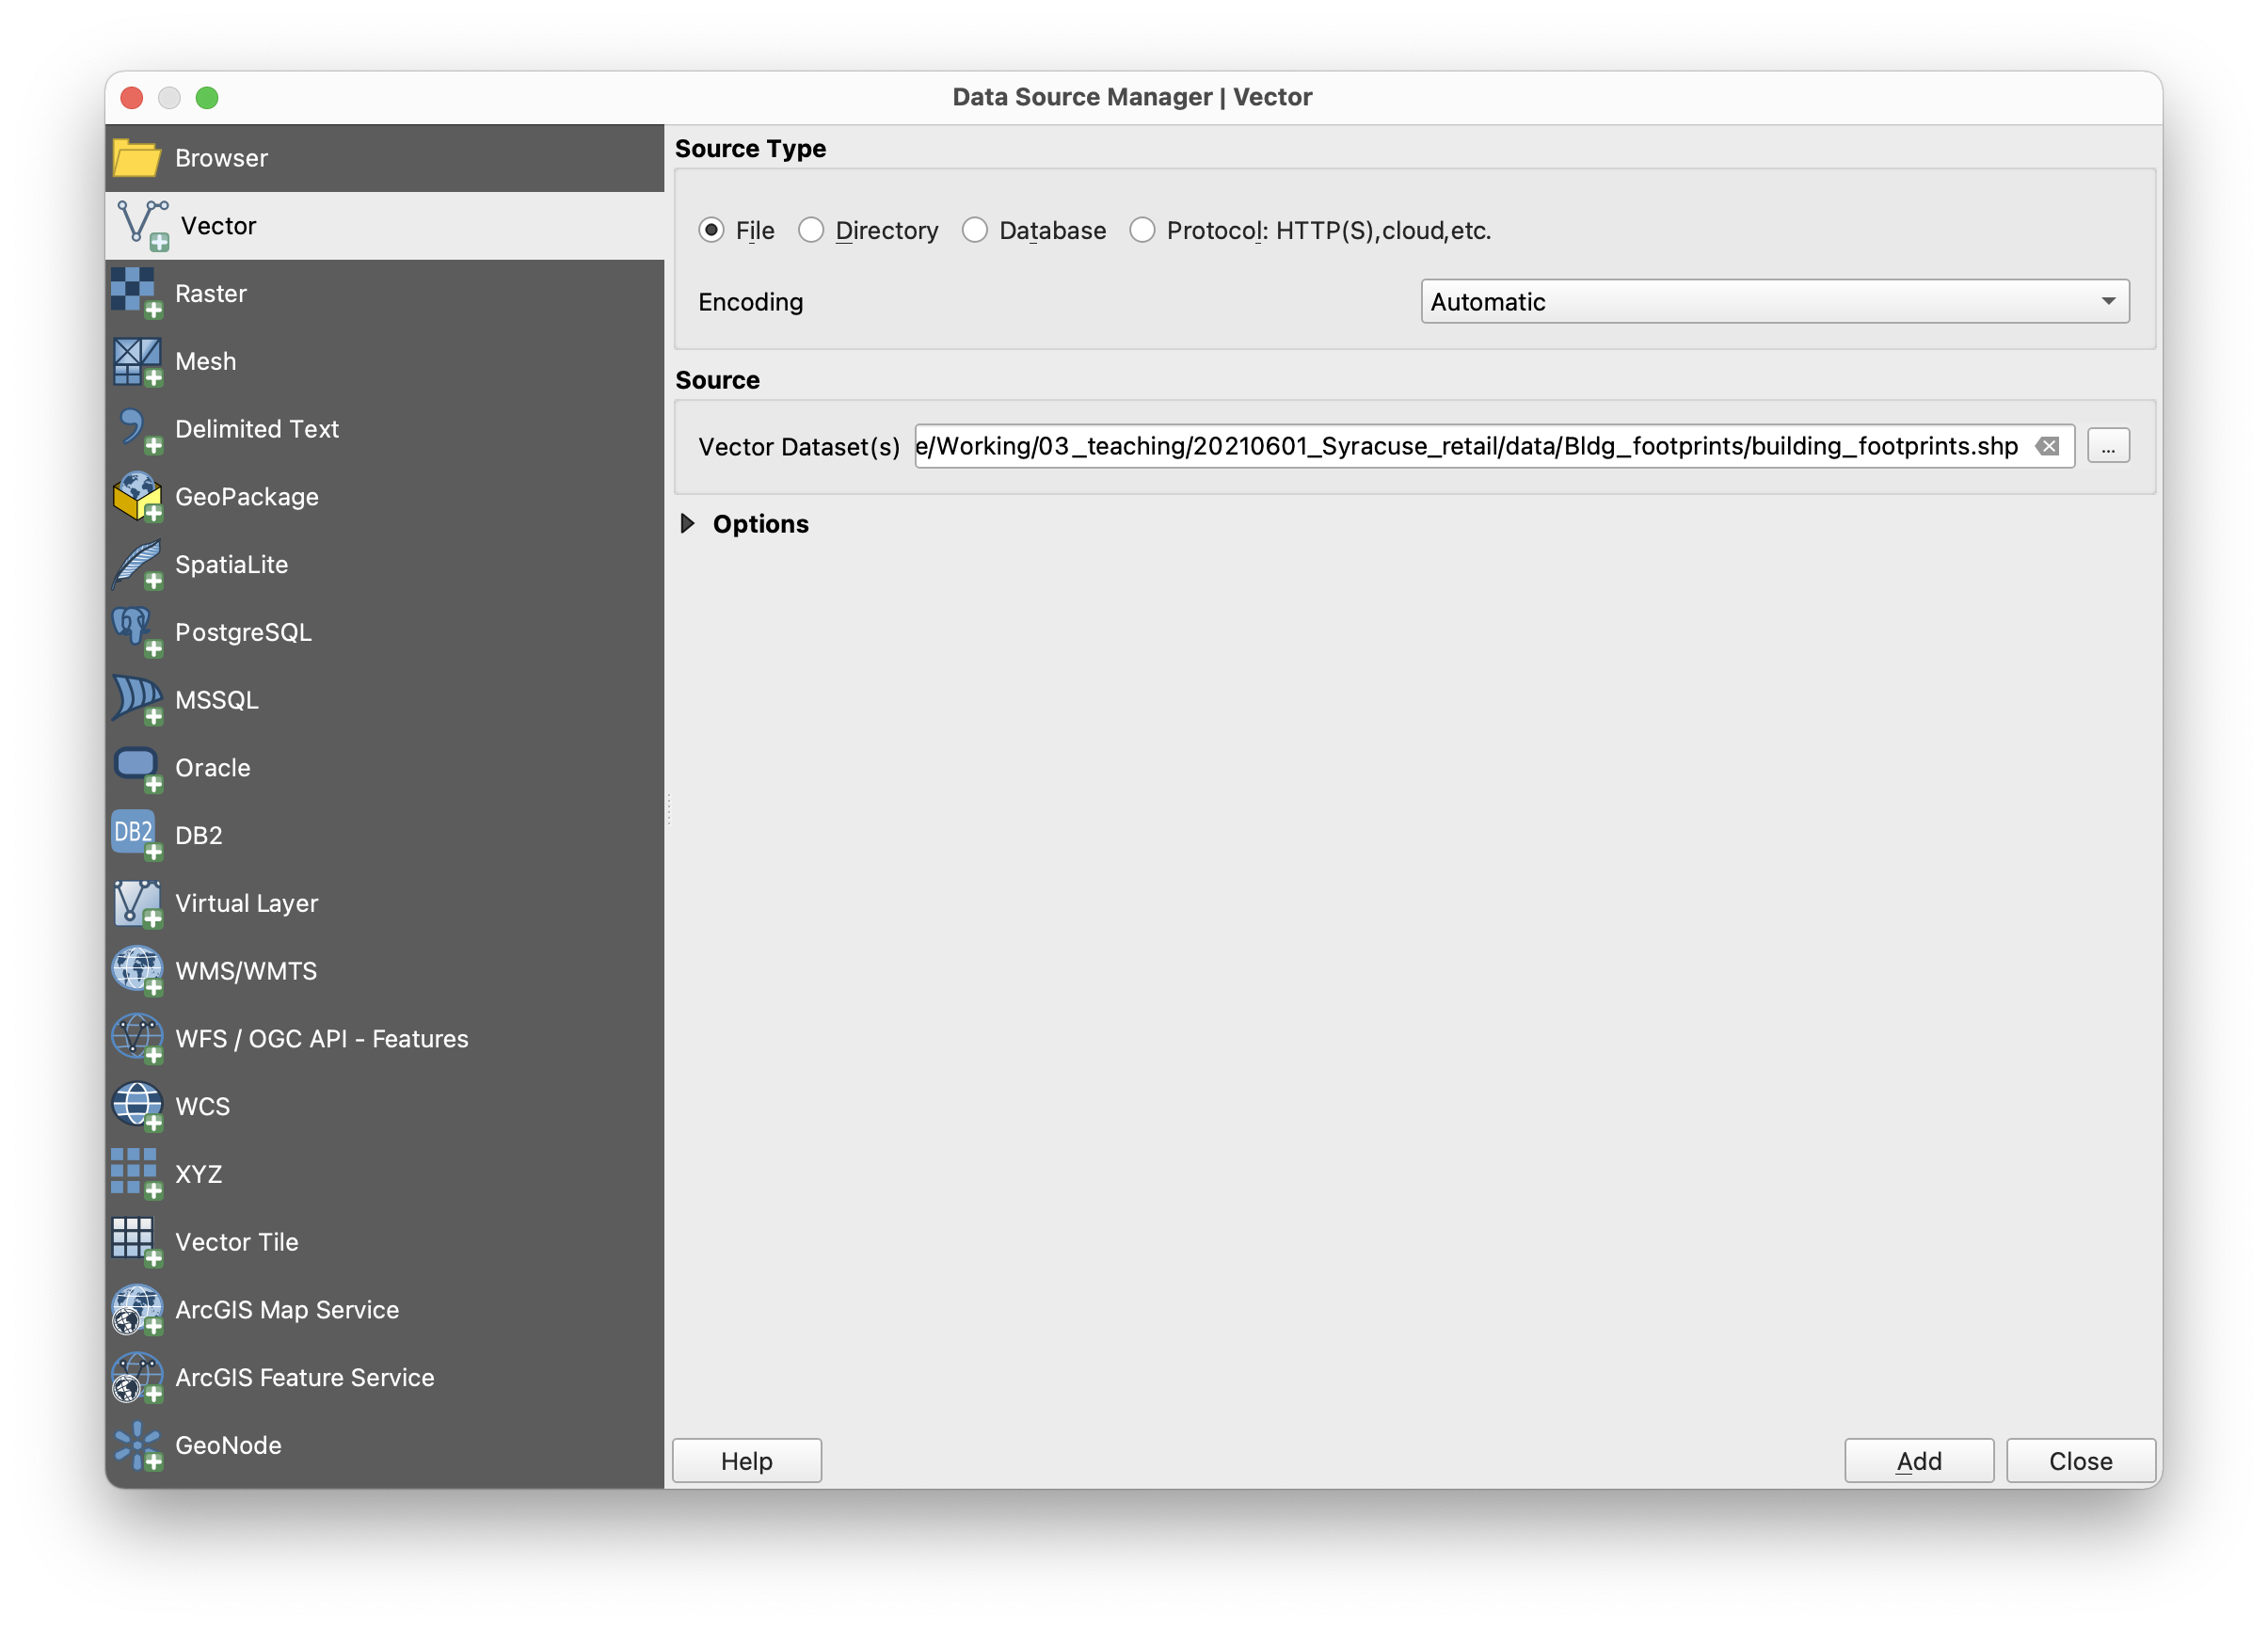
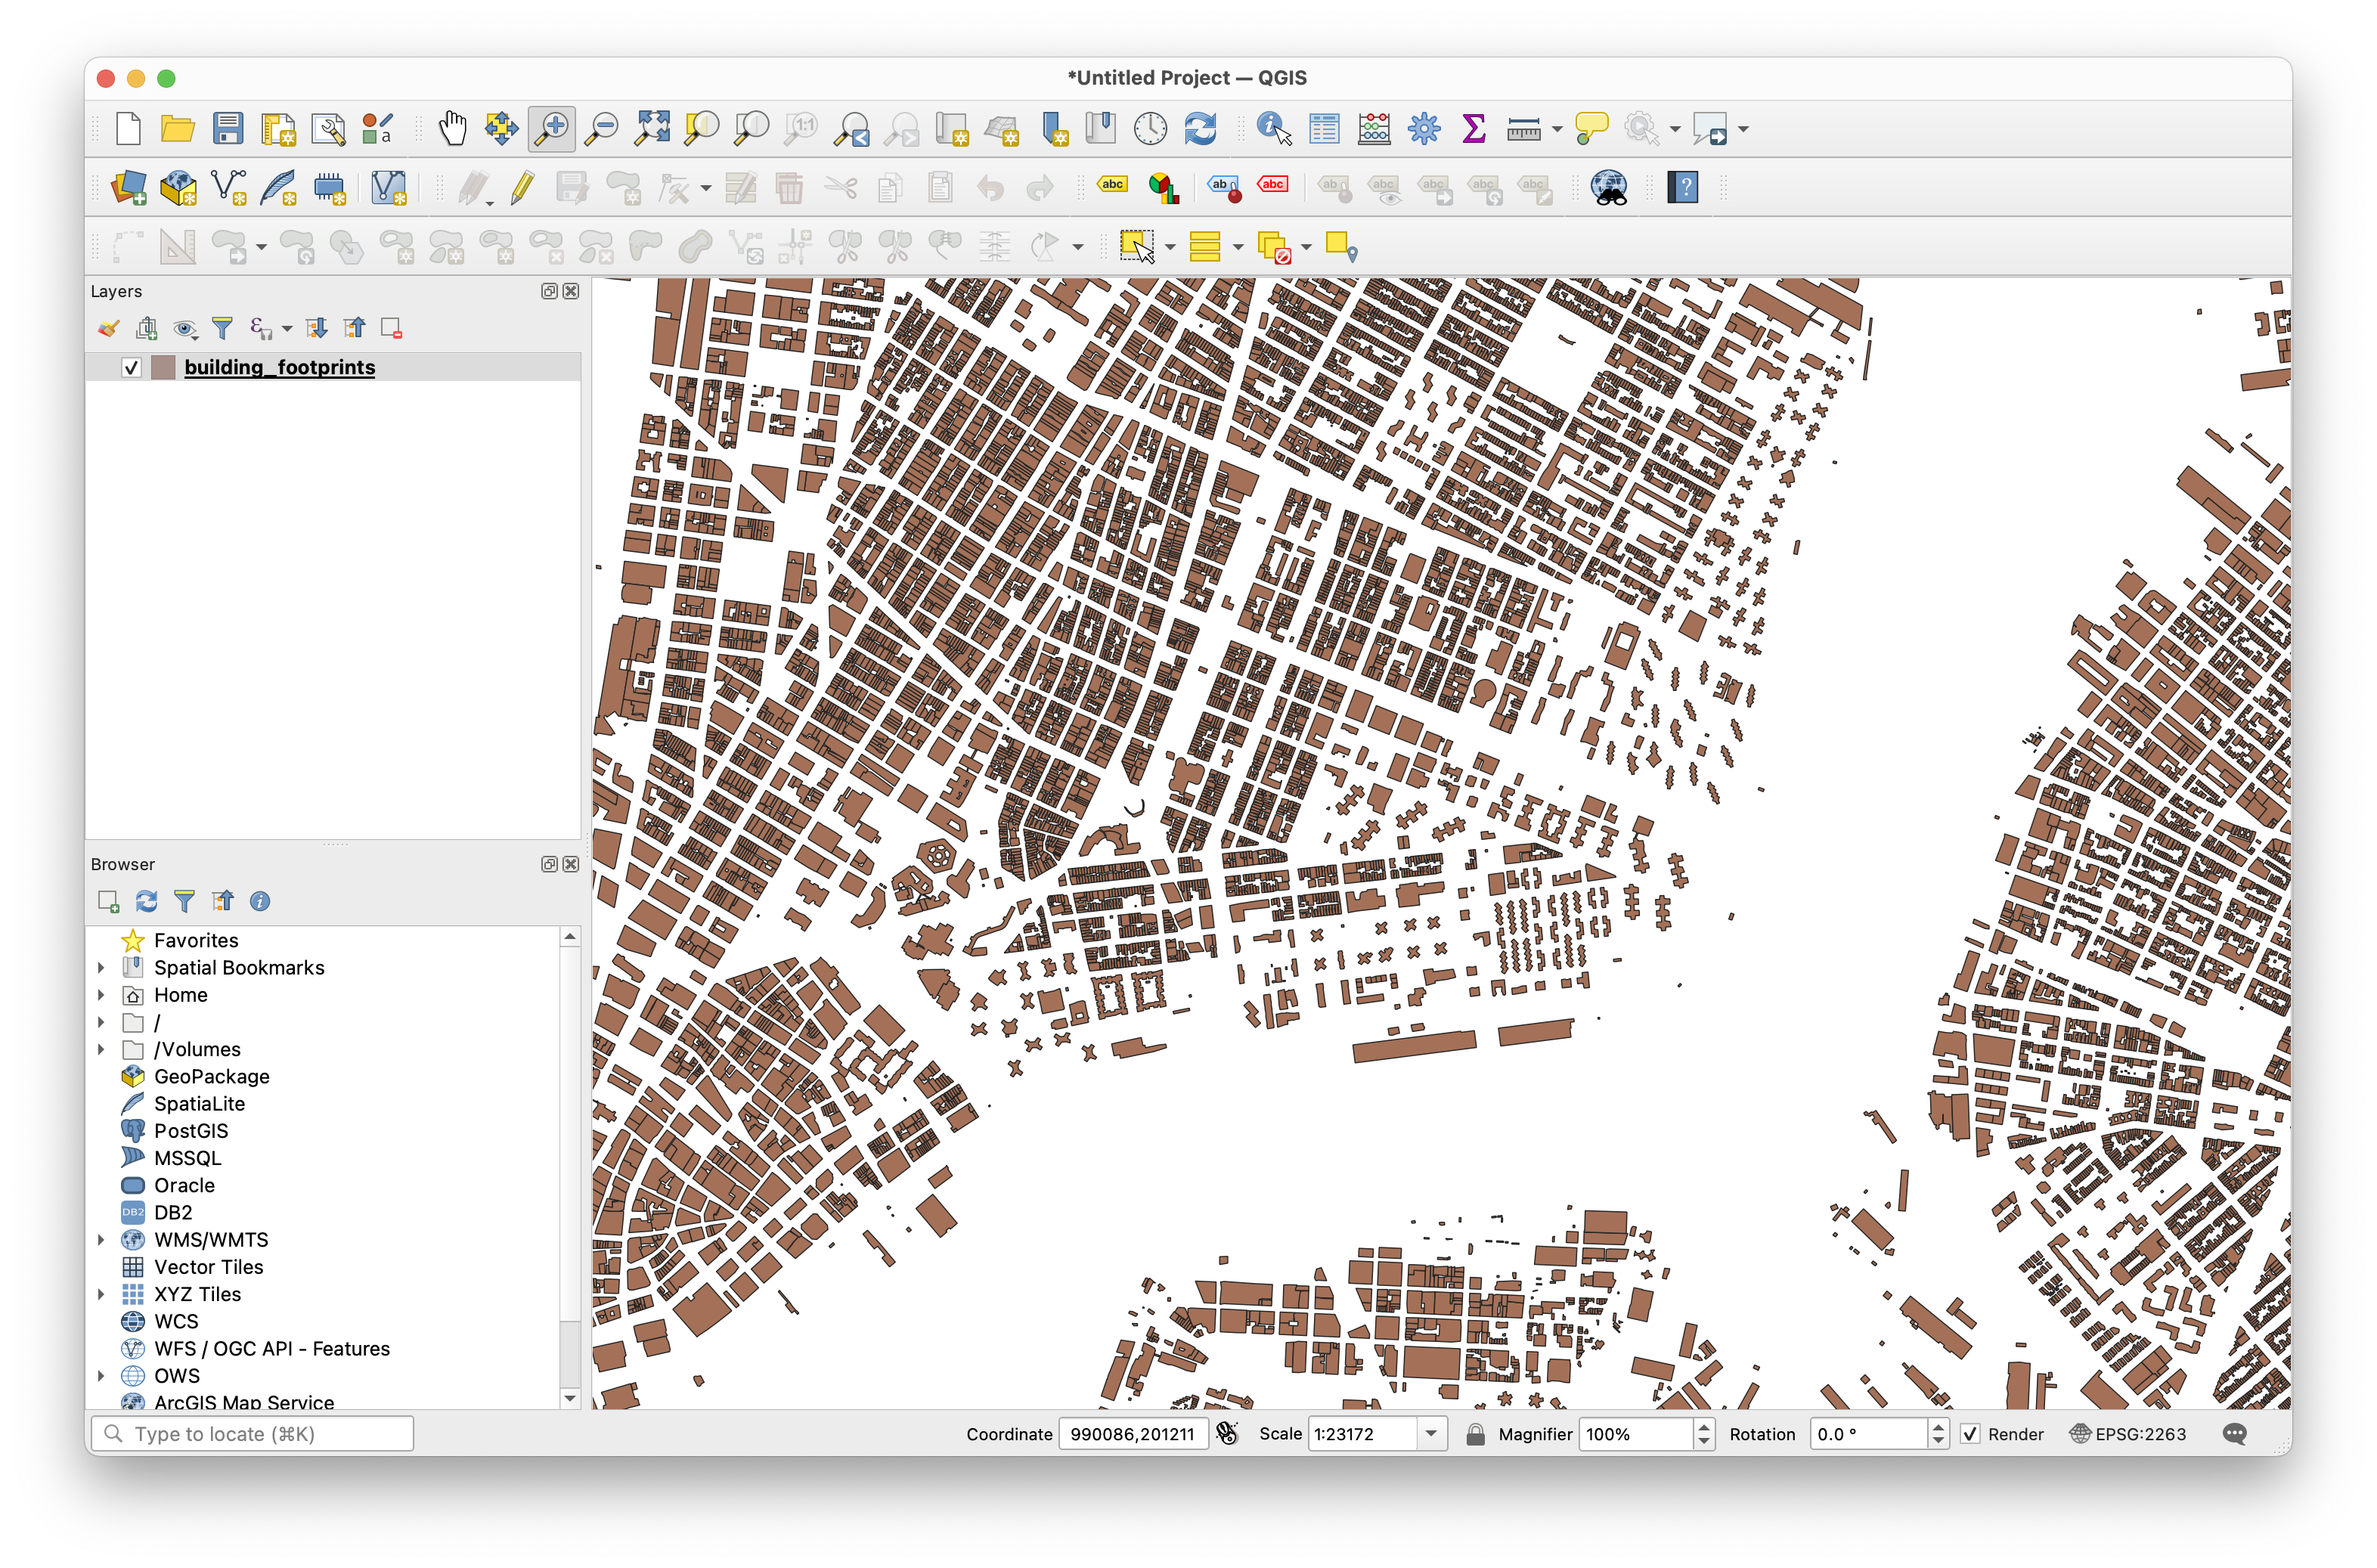
When the Data Source Manager menu appears select the Source Type as File then click on the ... and navigate to the data folder for this assignment. Within the Bldg_footprints folder select the building_footprints.shp file. Take care to select the file with the .shp file extension. QGIS will do the work of interpreting the full shapefile and will pull the projection and database information from the other files in the roads folder. Click Add.
You may receive a dialog box prompting you to select a datum transformation. Choose the first option listed (or the preferred option) and select OK.
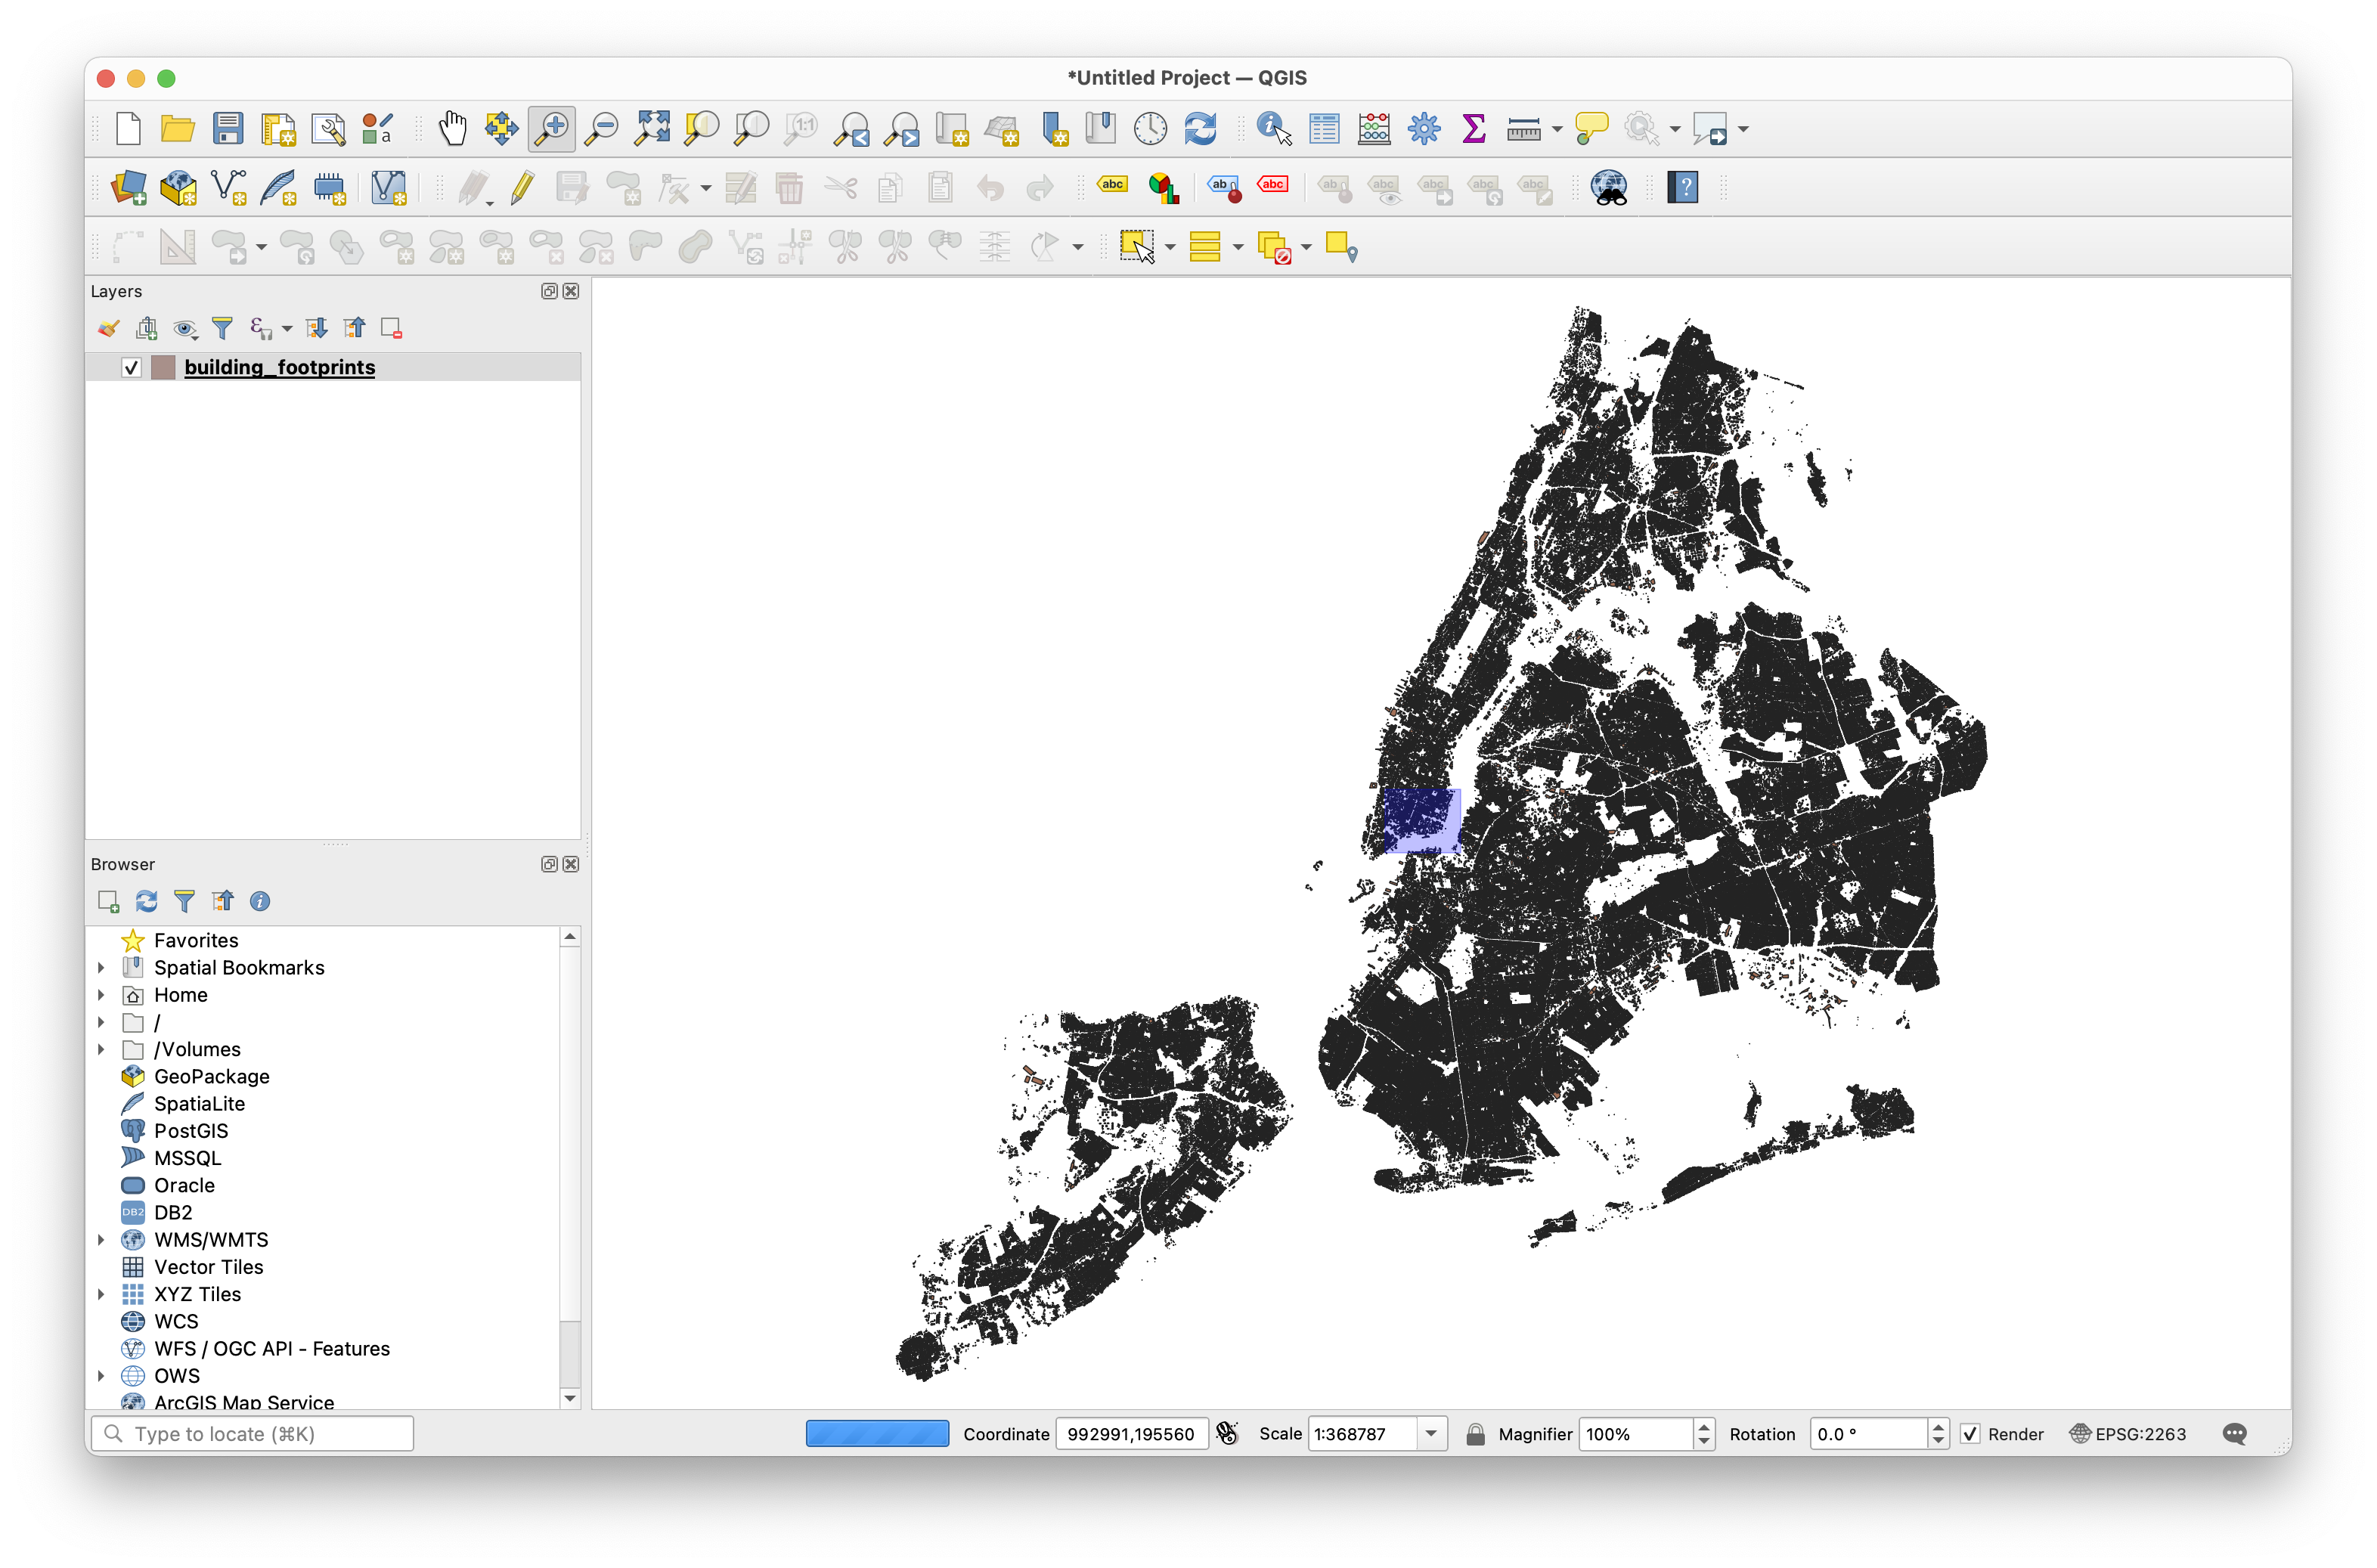
The building footprints data should be visible in your map window (note: this may take some time to appear as this is a large complicated file).
SAVE your project. Save the project in the directory (folder) where you are saving your work for this workshop. Title the project site-map-exercise.qgz.
Take a closer look at the building footprints by zooming in. Use the zoom in tool in the tool bar to do this:
Next we will add the NYC Planimetric Data. Again from the top menu bar select Layer and then Add Layer > Add Vector Layer.
When the Data Source Manager menu appears select the Source Type as Directory then click on the ... and navigate to the data folder for this assignment. Select OpenFileGDB as the Type and then NYC_DoITT_Planimetric_OpenData.gdb for the Vector Dataset(s). Select Add, then in the window to Select Vector Layers to Add that appears click Select All, check the box next to Add layers to group then OK as shown below:
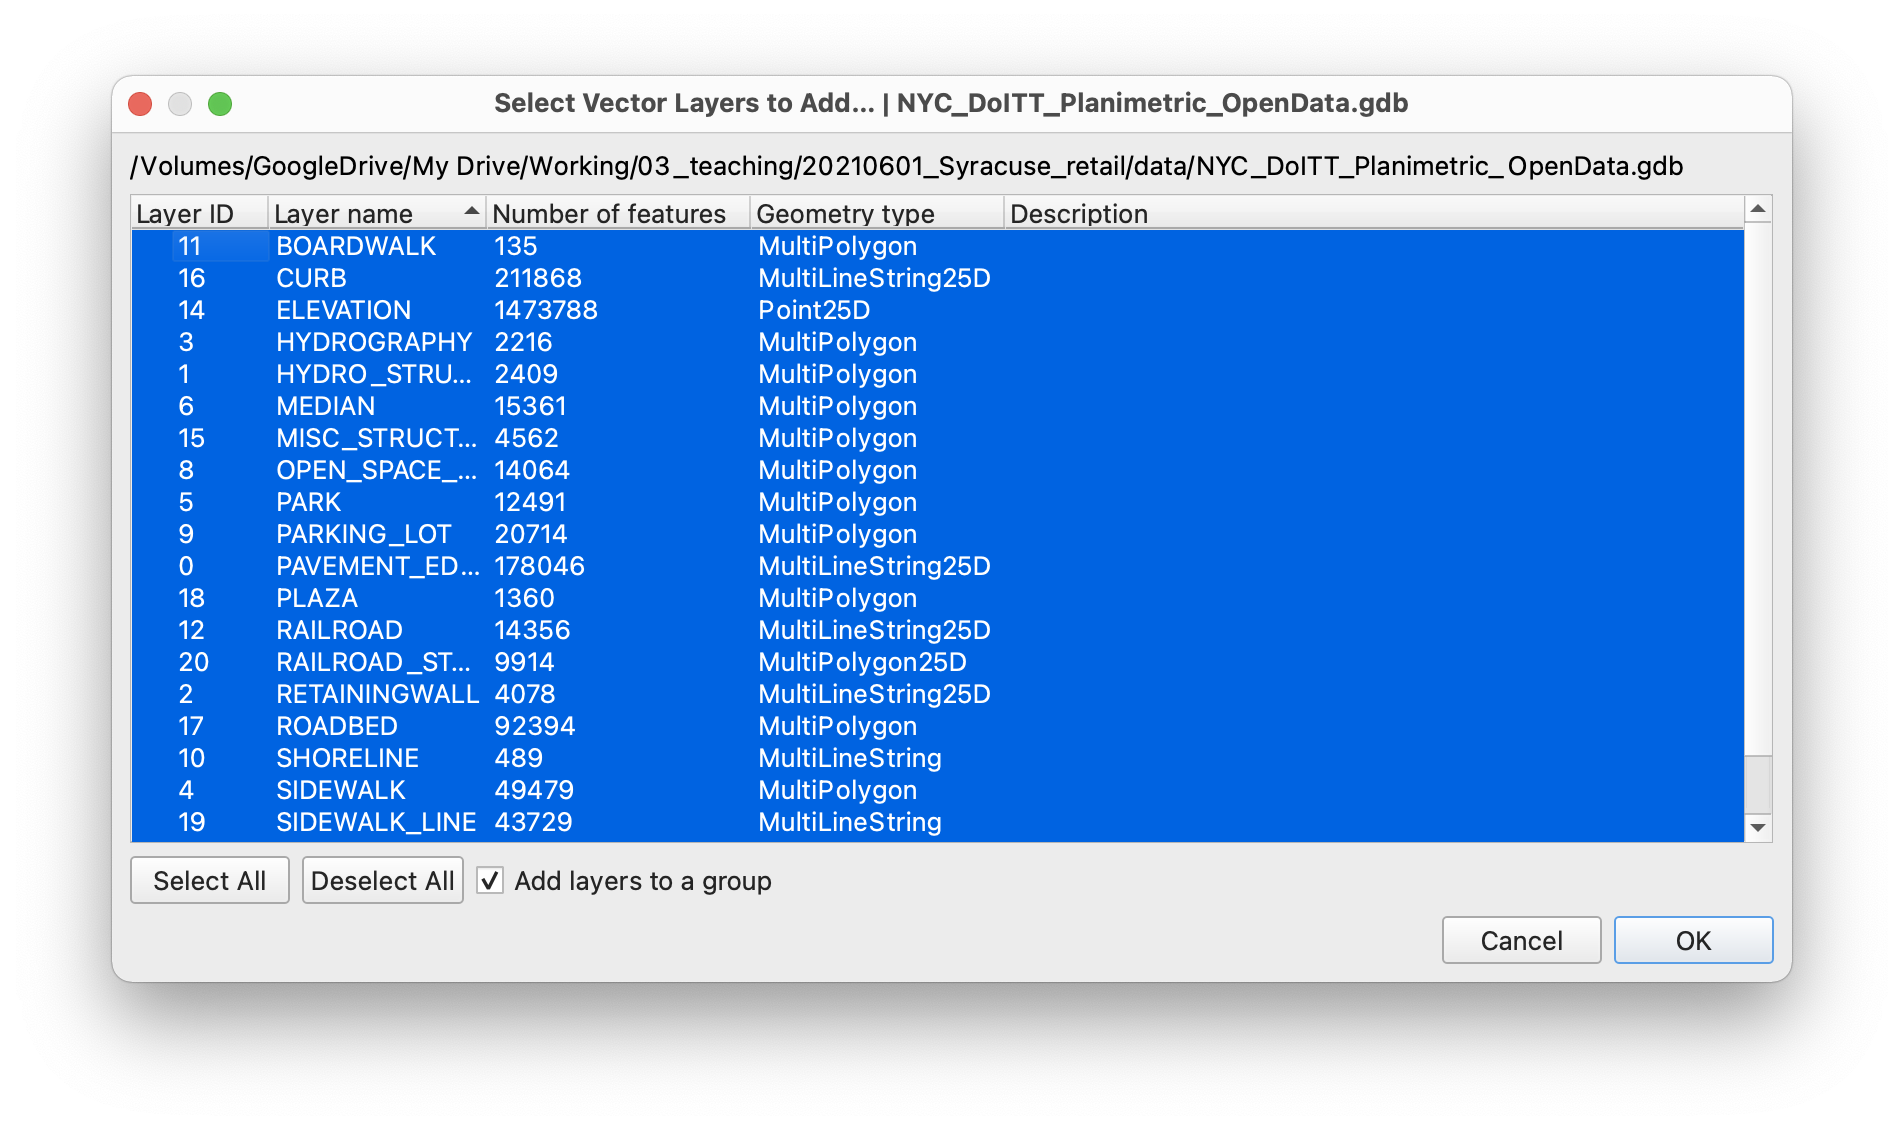
Then click Close.
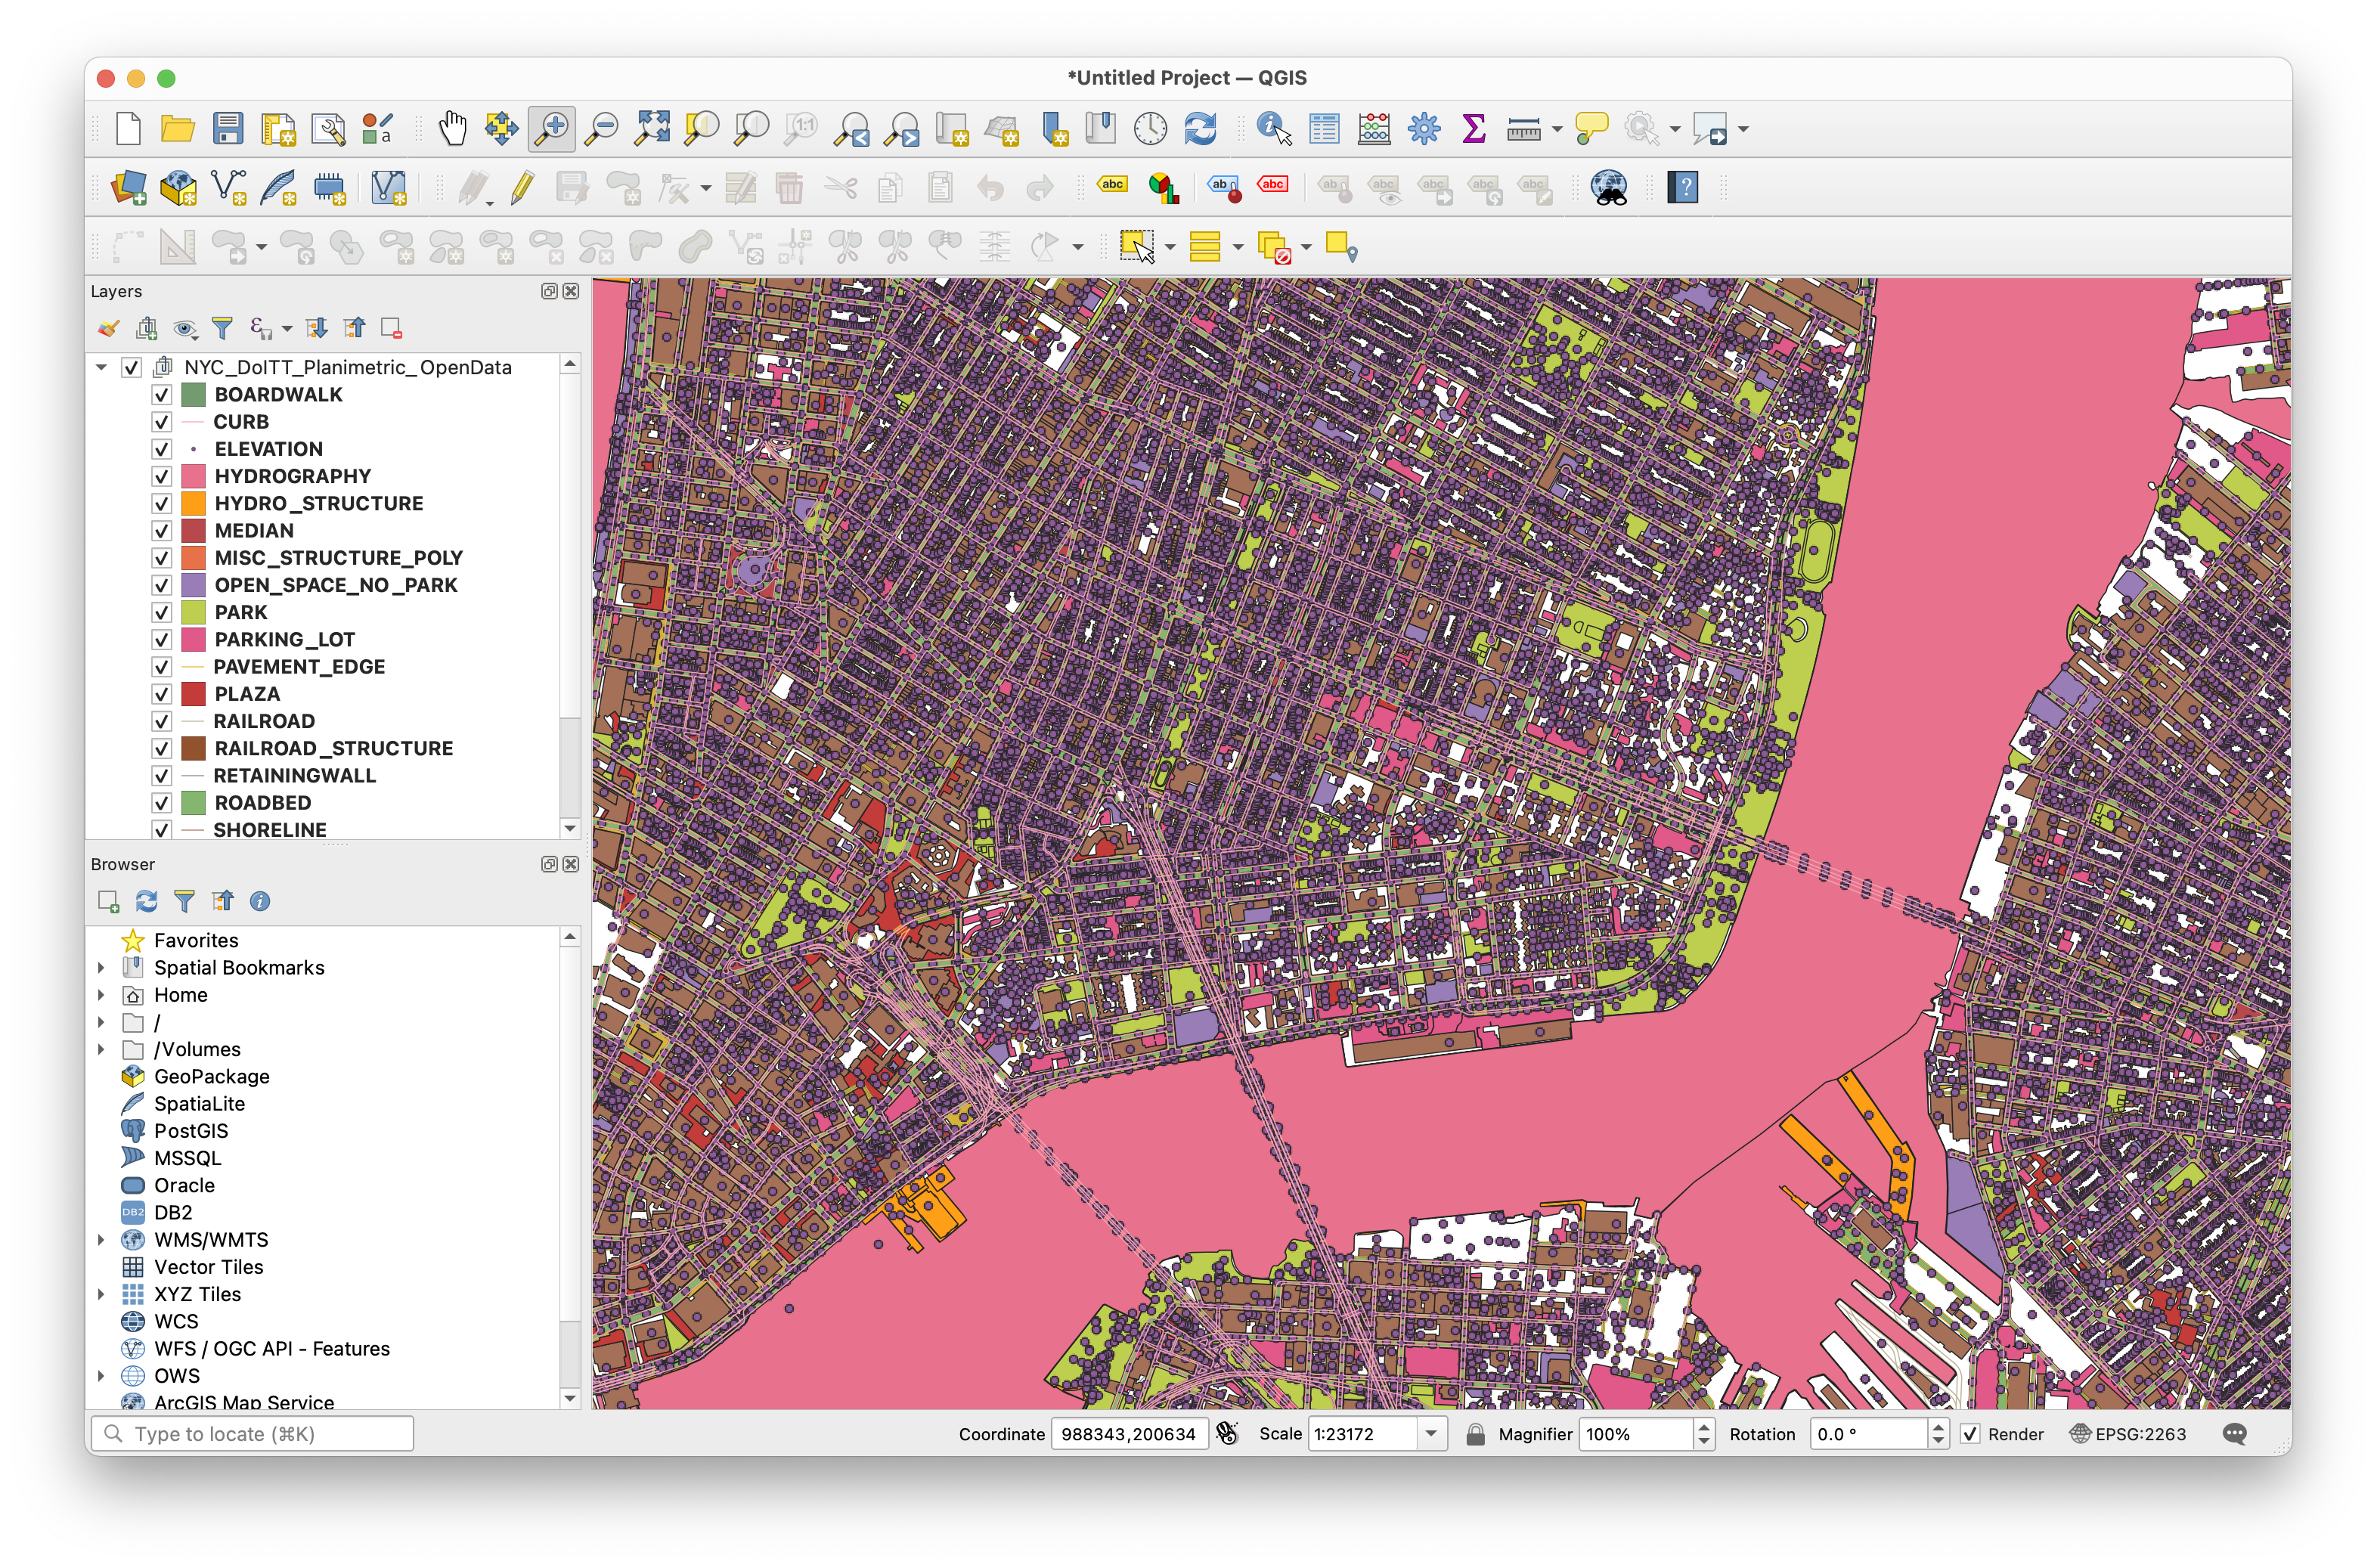
The layers added will each be assigned a random color – that will be different from the colors in the screenshot below.
To add the point of interest data, again from the top menu bar select Layer and then Add Layer > Add Vector Layer. Source Type as File then click on the ... and navigate to the data folder for this assignment. Then select nyc_poi.geojson.
Then click Add and then Close.
A new point dataset will be added to your map.
Toggle the visibility of the planimetric data layers so that you can see the point layer with business and other points of interest that has been added to your project.
SAVE your project.
Creating a spatial dataset from xy coordinates
The last dataset, NYC Street Tree Census, that you will add to your project requires an additional step. The street tree census is distributed as a .csv file (aka tabular data) that contains the latitude and longitude coordinates for each tree that was surveyed.
You will often encounter situations where you are given data for point locations as a table with latitude and longitude coordinates. This is a dataset with spatial information embedded in it, however we need to take one extra step to transform this data into a format that can be visualized on a map by a GIS program.
To create a point dataset with the locations of street trees in NYC, use the top menu bar to select Layer and then Add Layer > Add Delimited Text Layer.
The Data Source Manager | Delimited Text window will appear. Use the ... button to select the 2015Street_Tree_Census-_Tree_Data.csv file from the workshop data folder. Then make the following selections:
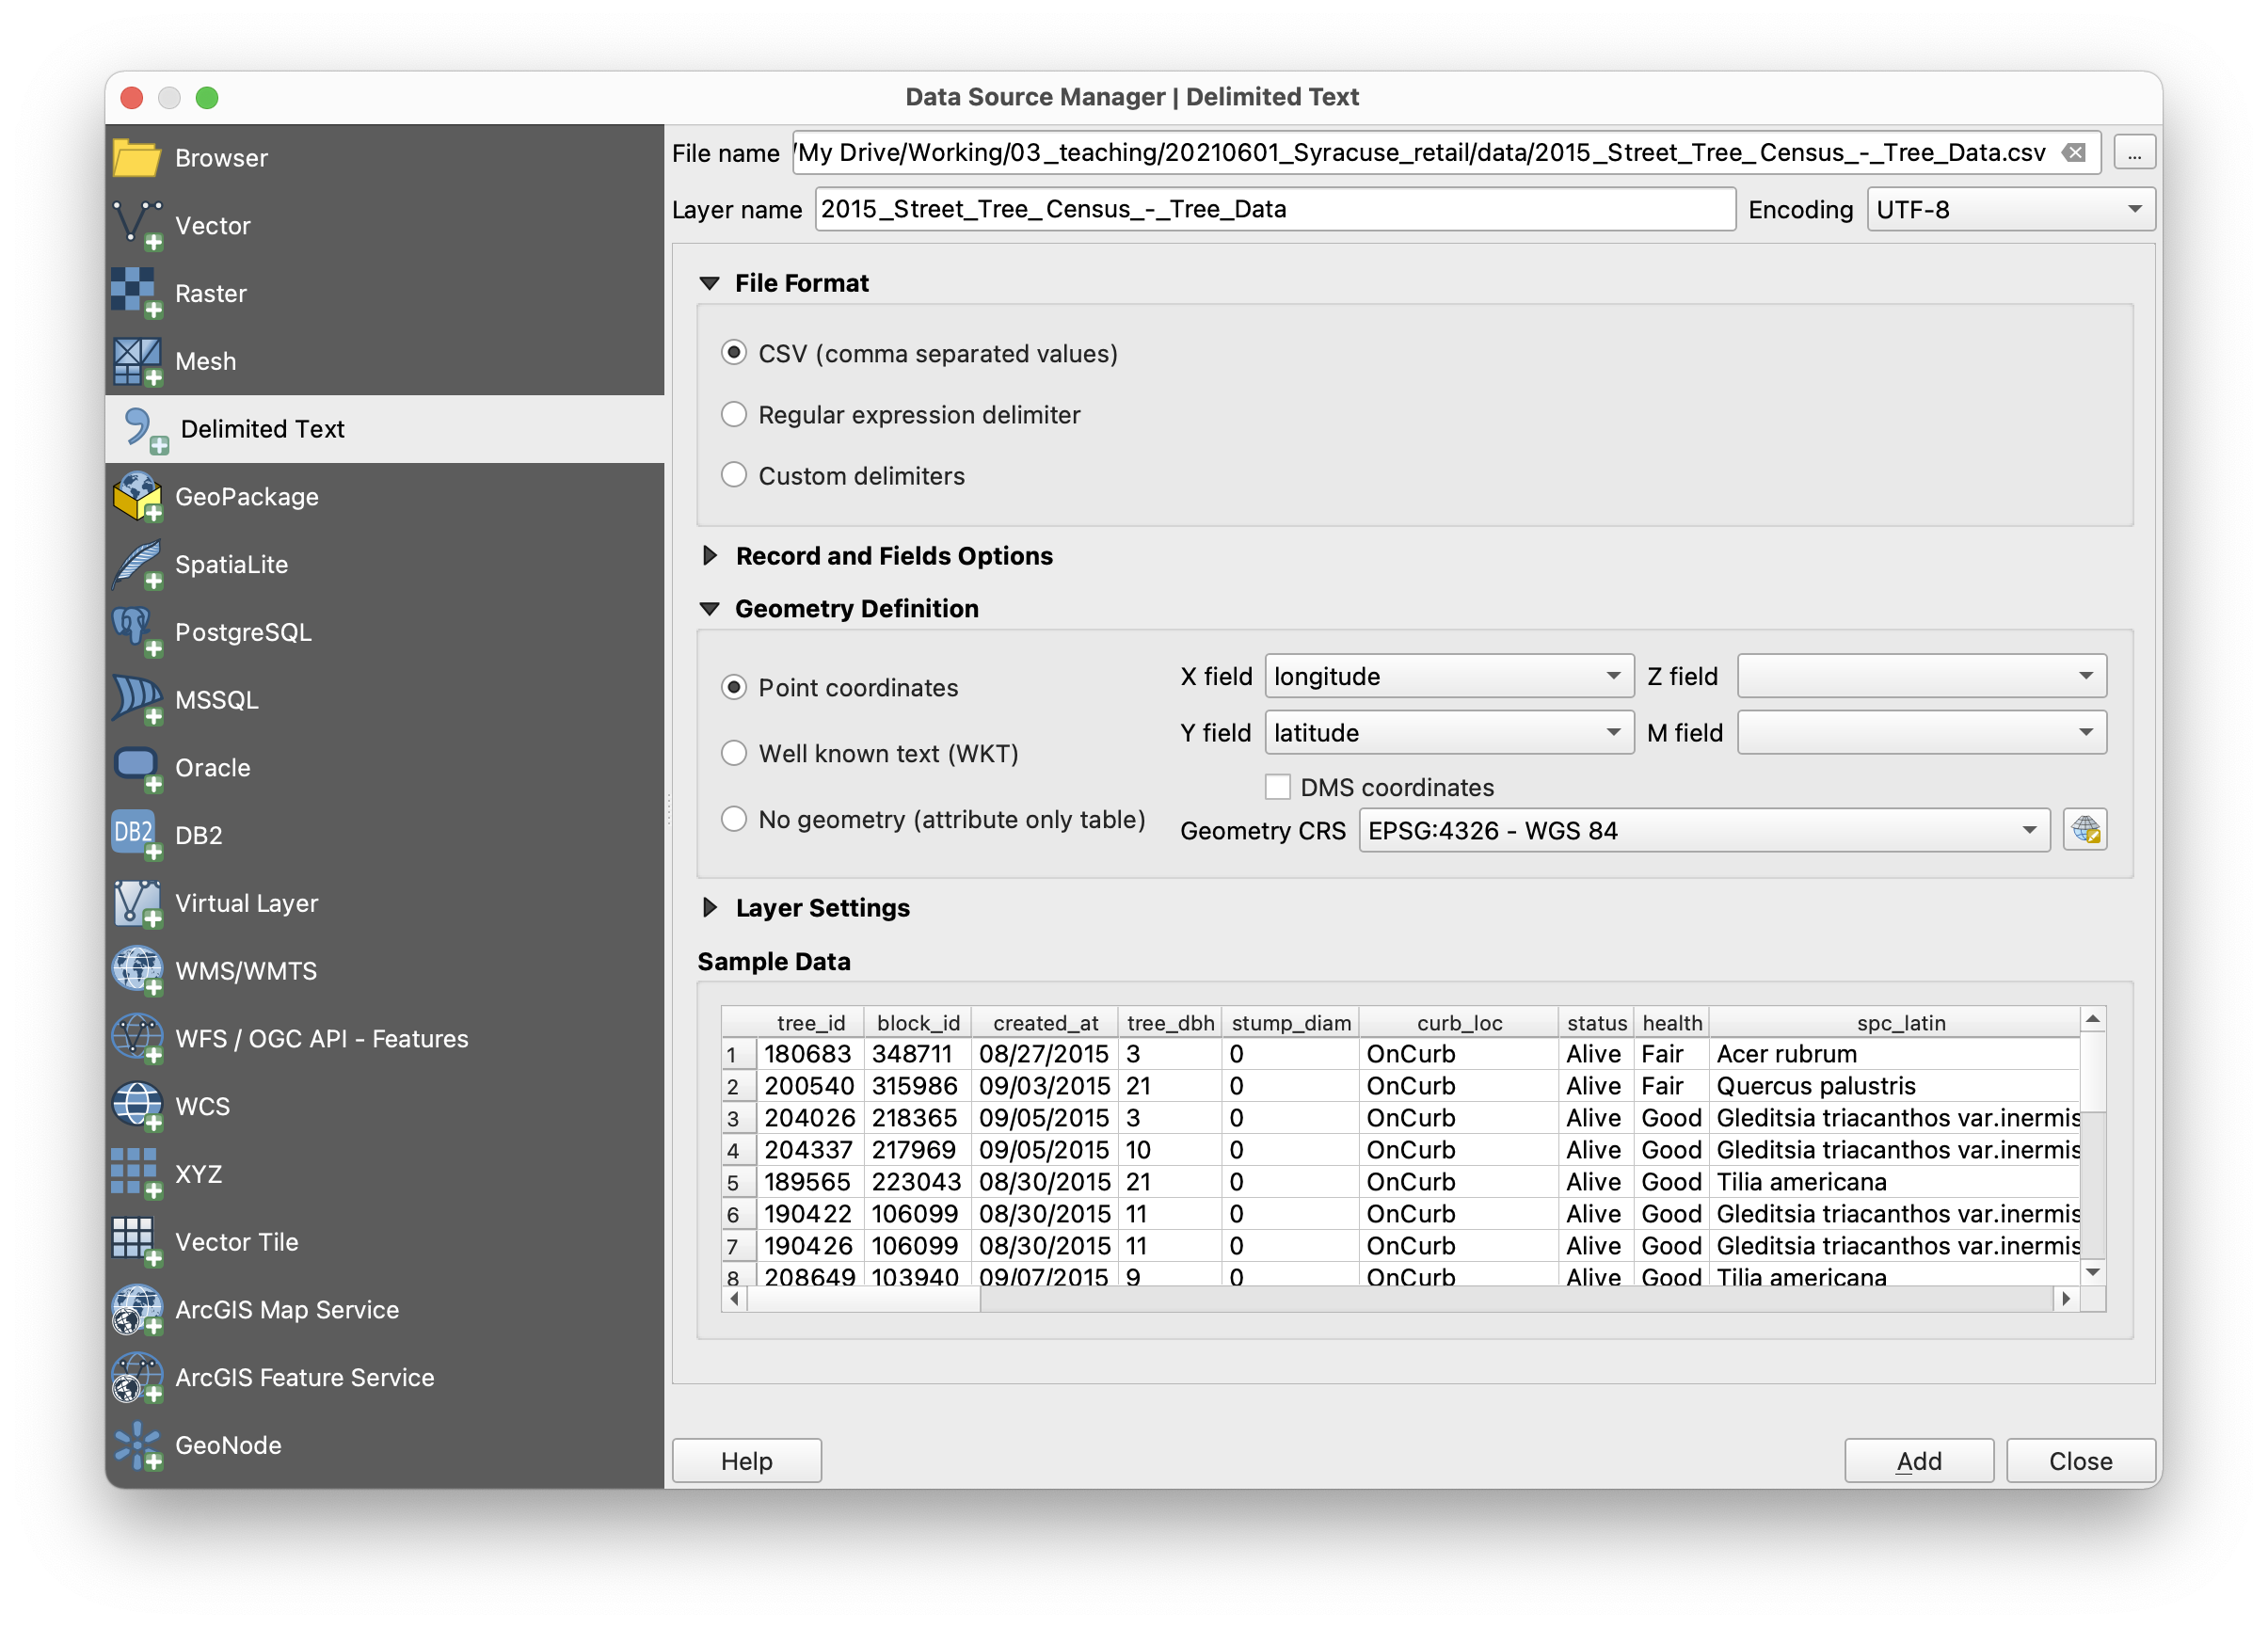
Specify the geometry CRS as World Geodetic Survey 1984 (EPSG:4326). If this is not already an option in the drop down menu click on the button circled above and search for WGS 84 in the Coordinate Reference System Selector window that opens.
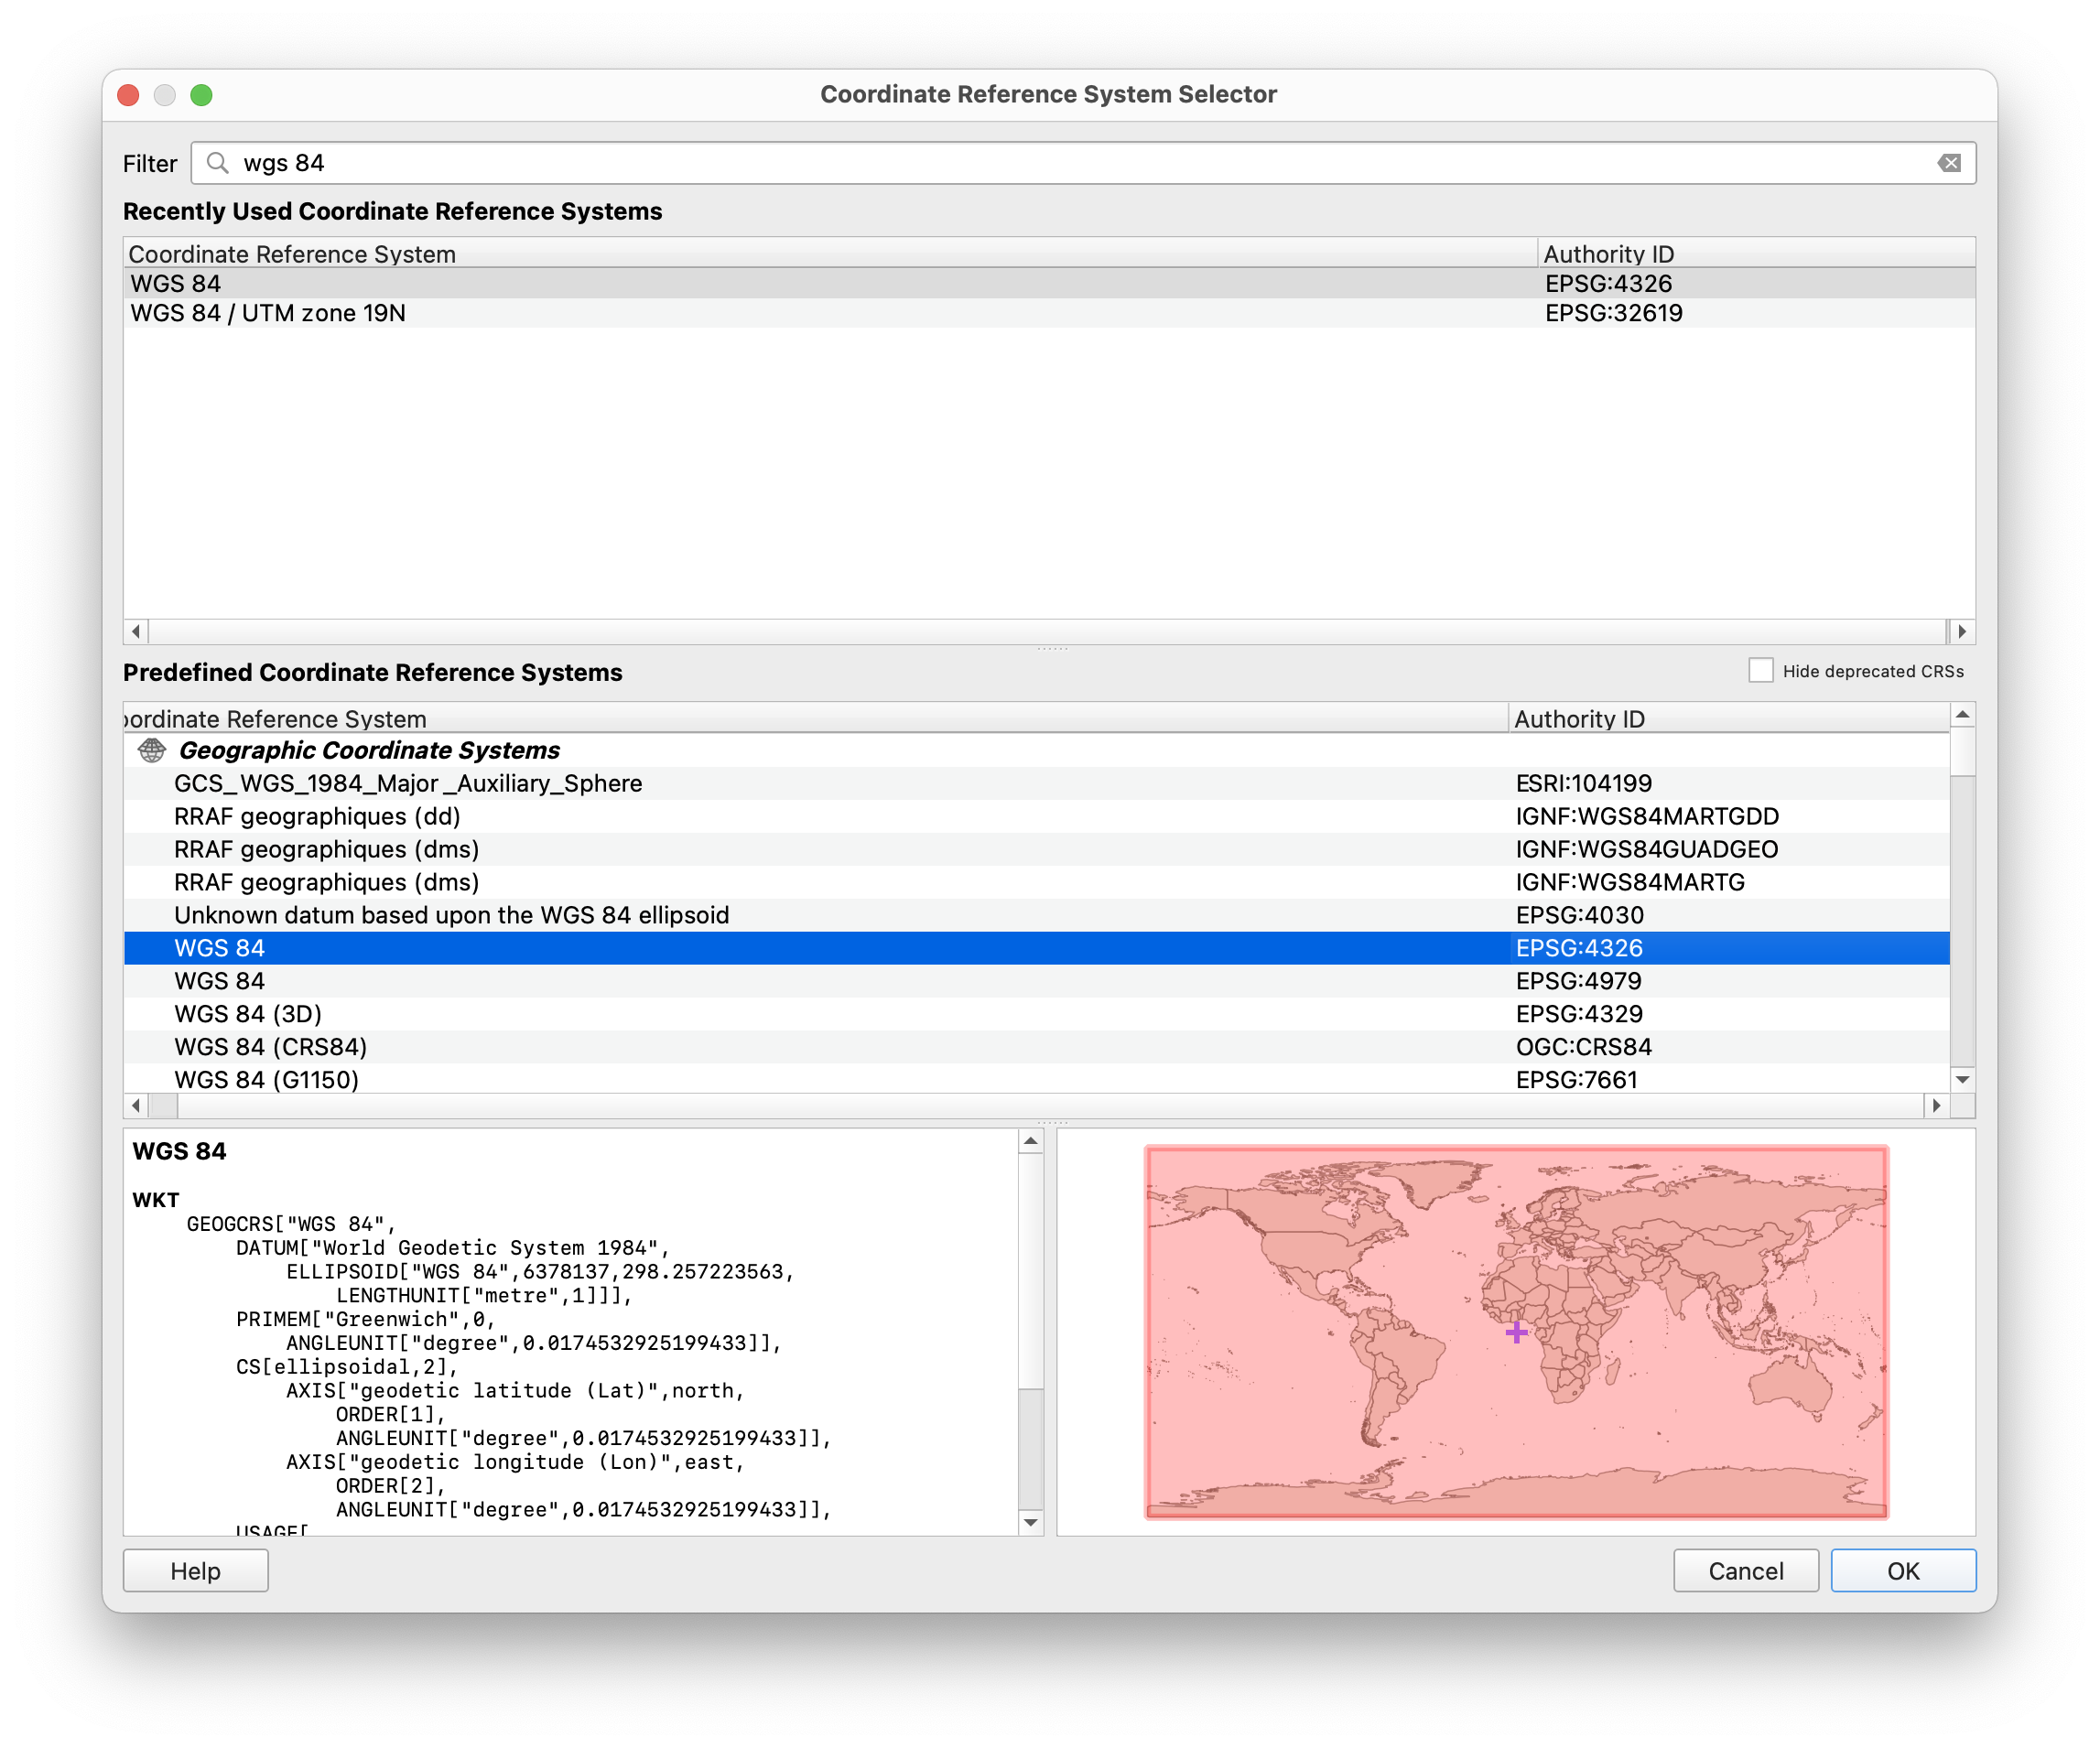
Click OK.
You should now see point locations for all of the street trees in NYC – pretty awesome right?!
Right now we are visualizing point locations that are stored as latitude and longitude coordinates in a CSV file. To permanently save a point dataset of the street tree locations we need to export this layer as a new dataset.
To do this right click on the name of the street trees layer in the Layers Panel > Export > Save Features As
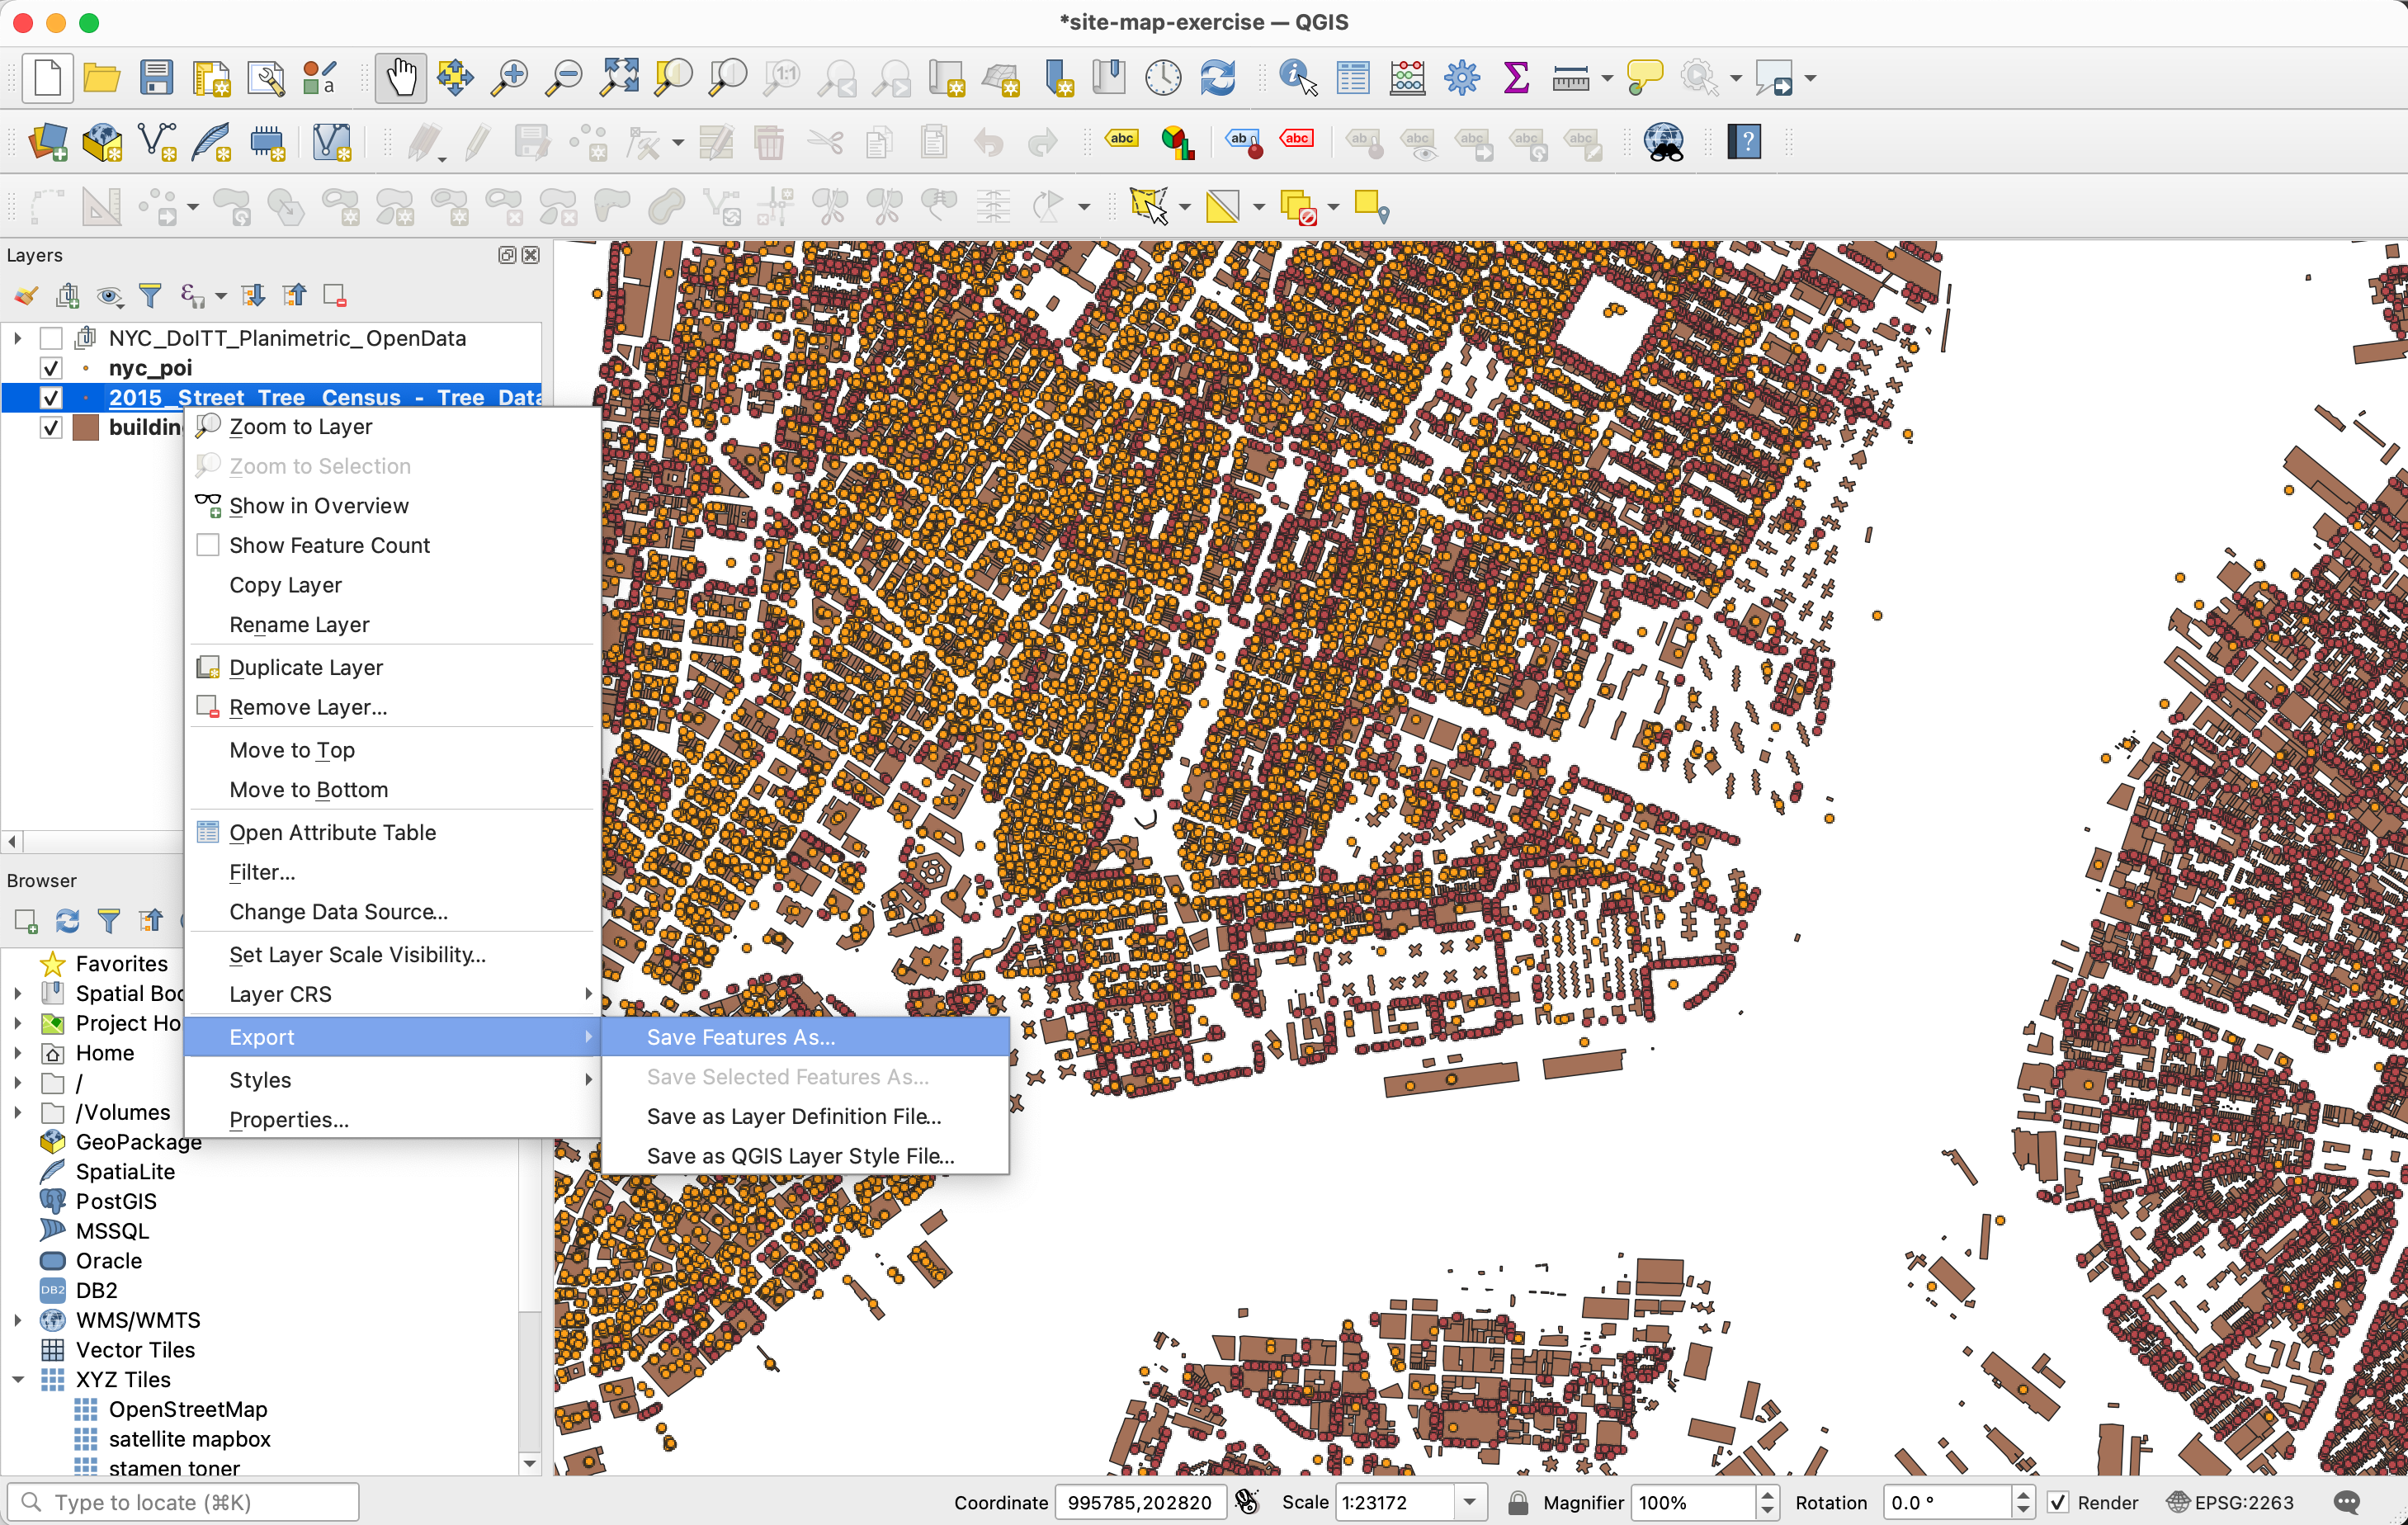
In the window that opens select ESRI Shapefile as the file format; use the ... button to select a location to save the exported files and name the file; then select EPSG:2263 as the coordinate reference system; make sure the box Add saved file to map is checked. Click OK. (this is a big file so it may take a few minutes to save and get rendered in your project.)
You can now remove the original street tree layer from your project by clicking on that layer’s name in the Layers Panel and selecting remove layer.
Defining a site area
Now we will define a focus area or study area and create a new dataset to mark out its boundaries. We will use this to select just a subset of the large NYC-wide datasets we are working with.
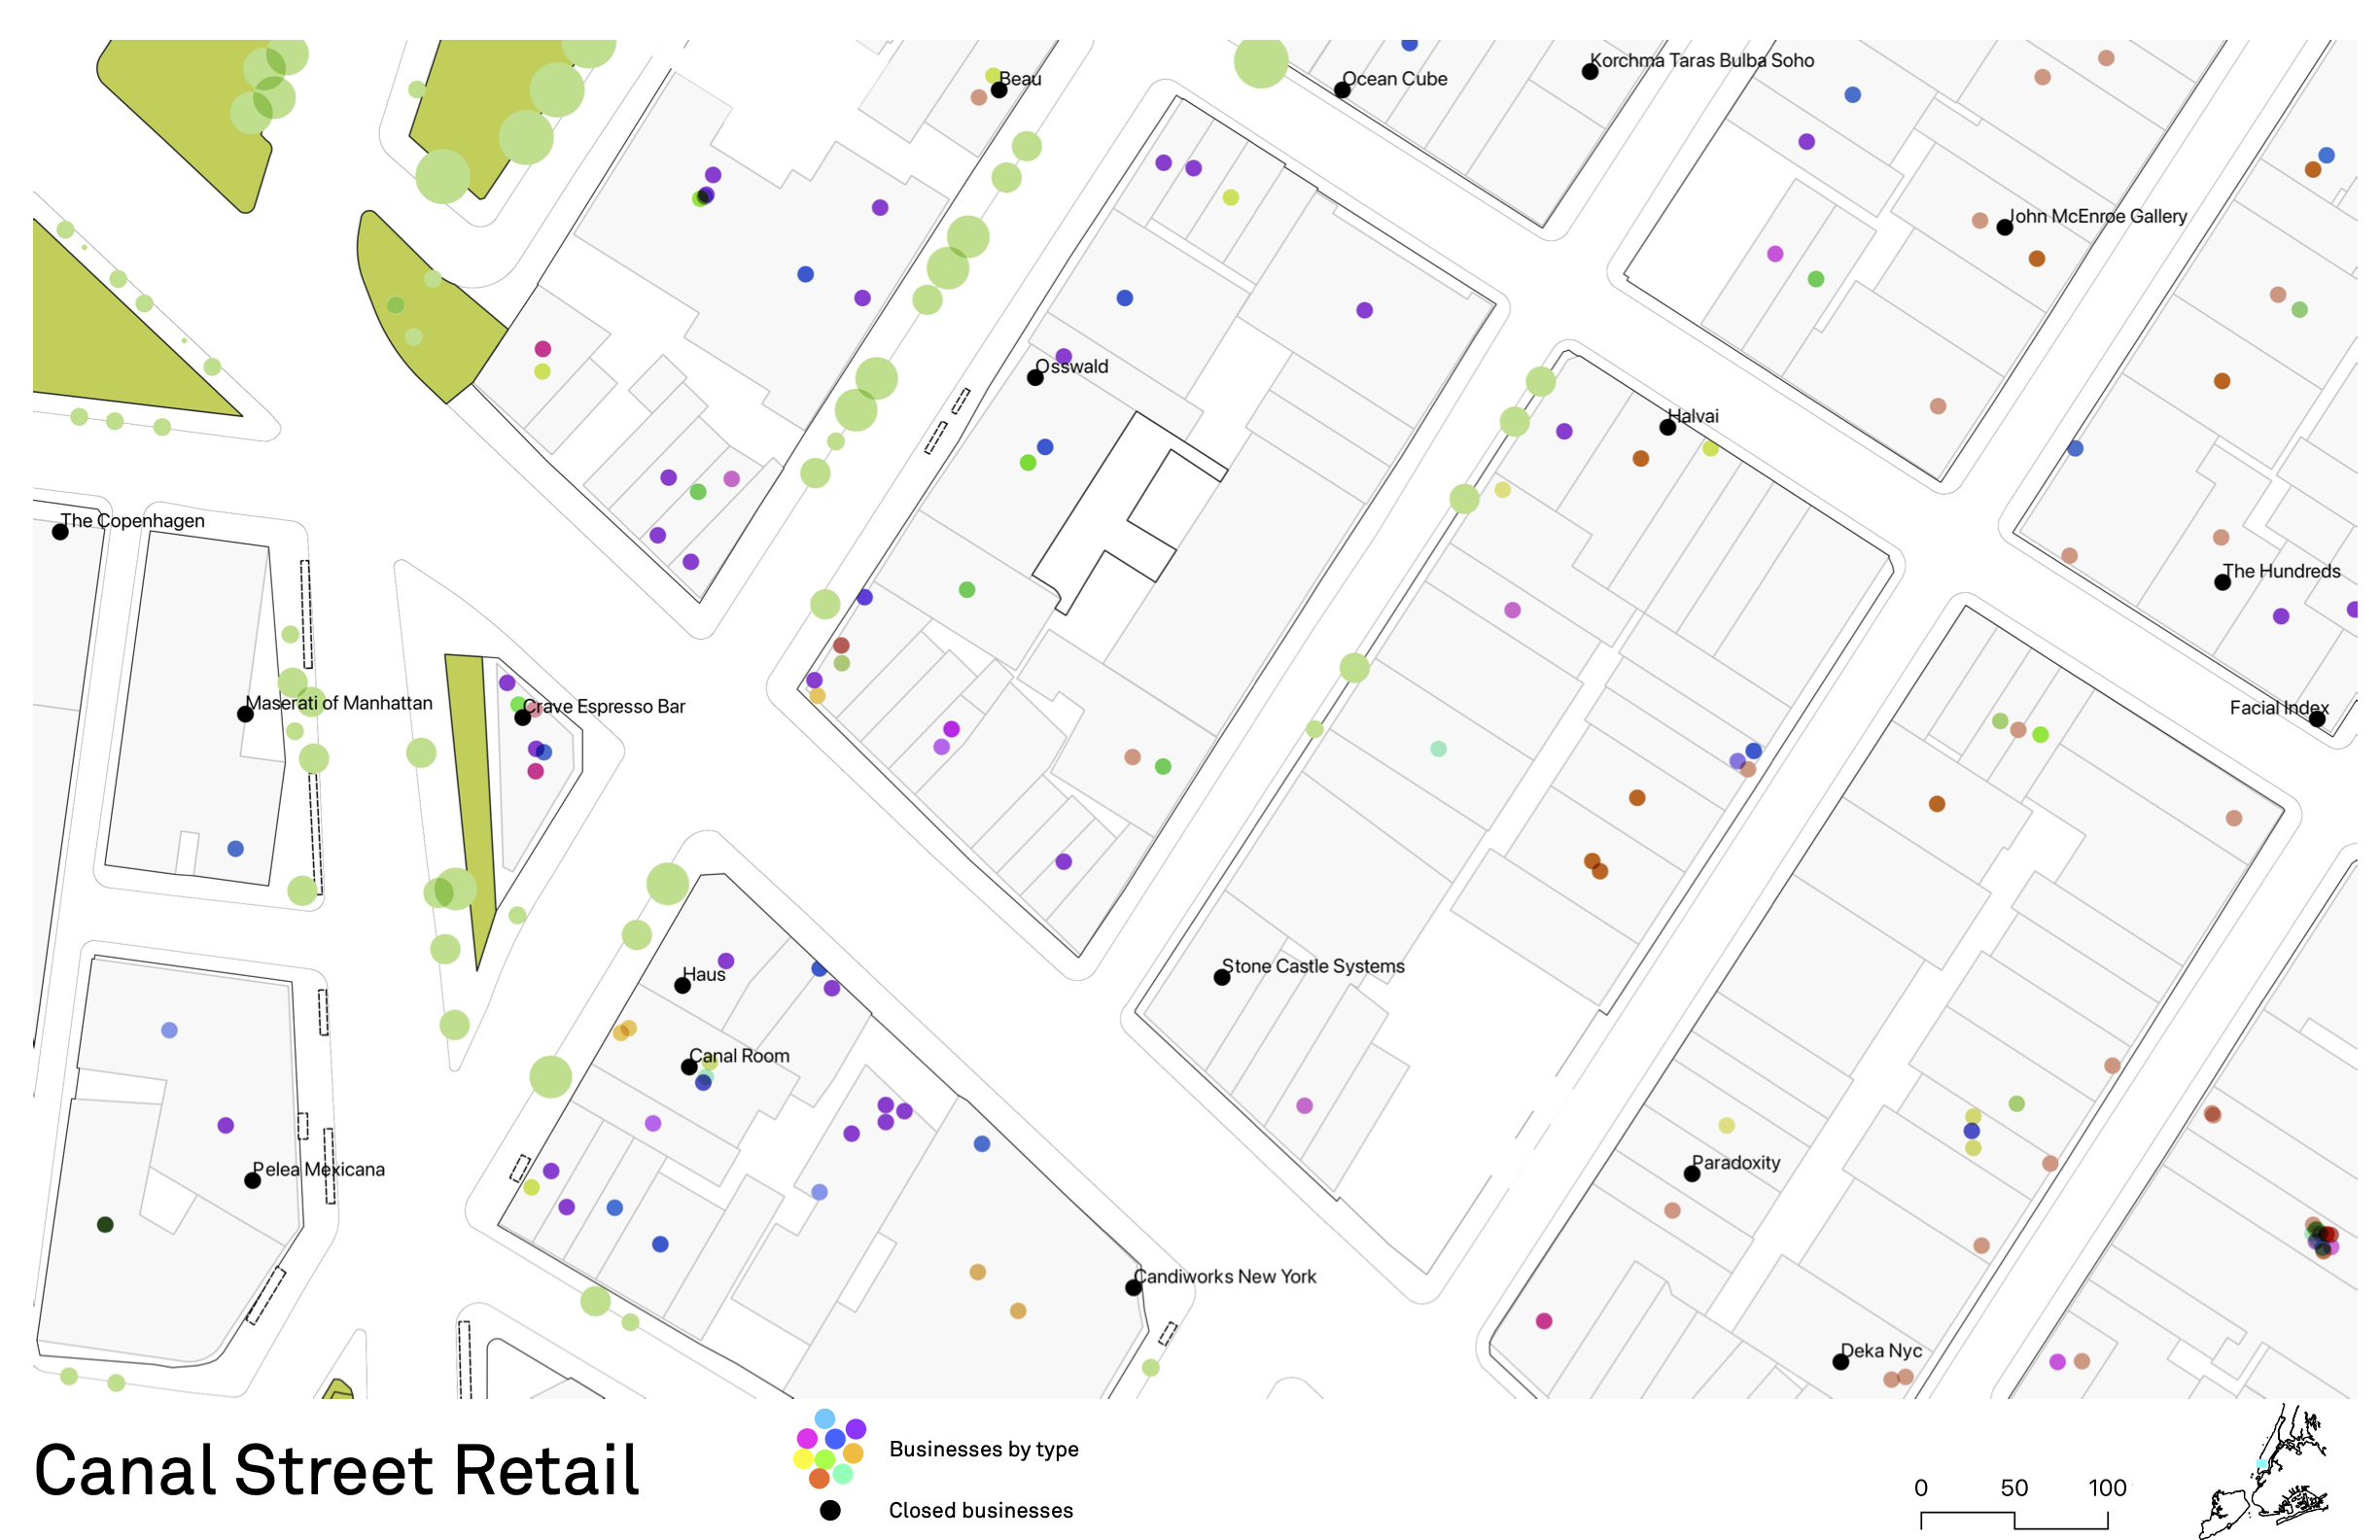
In this exercise we will walk through creating a story area surrounding Canal Street in Downtown Manhattan. This was one of the locations surveyed by the Department of City Planning in their assessment of storefront vacancy in 2019.
Begin by creating a new shapefile layer. Navigate to Layer>Create Layer then make the following selections:
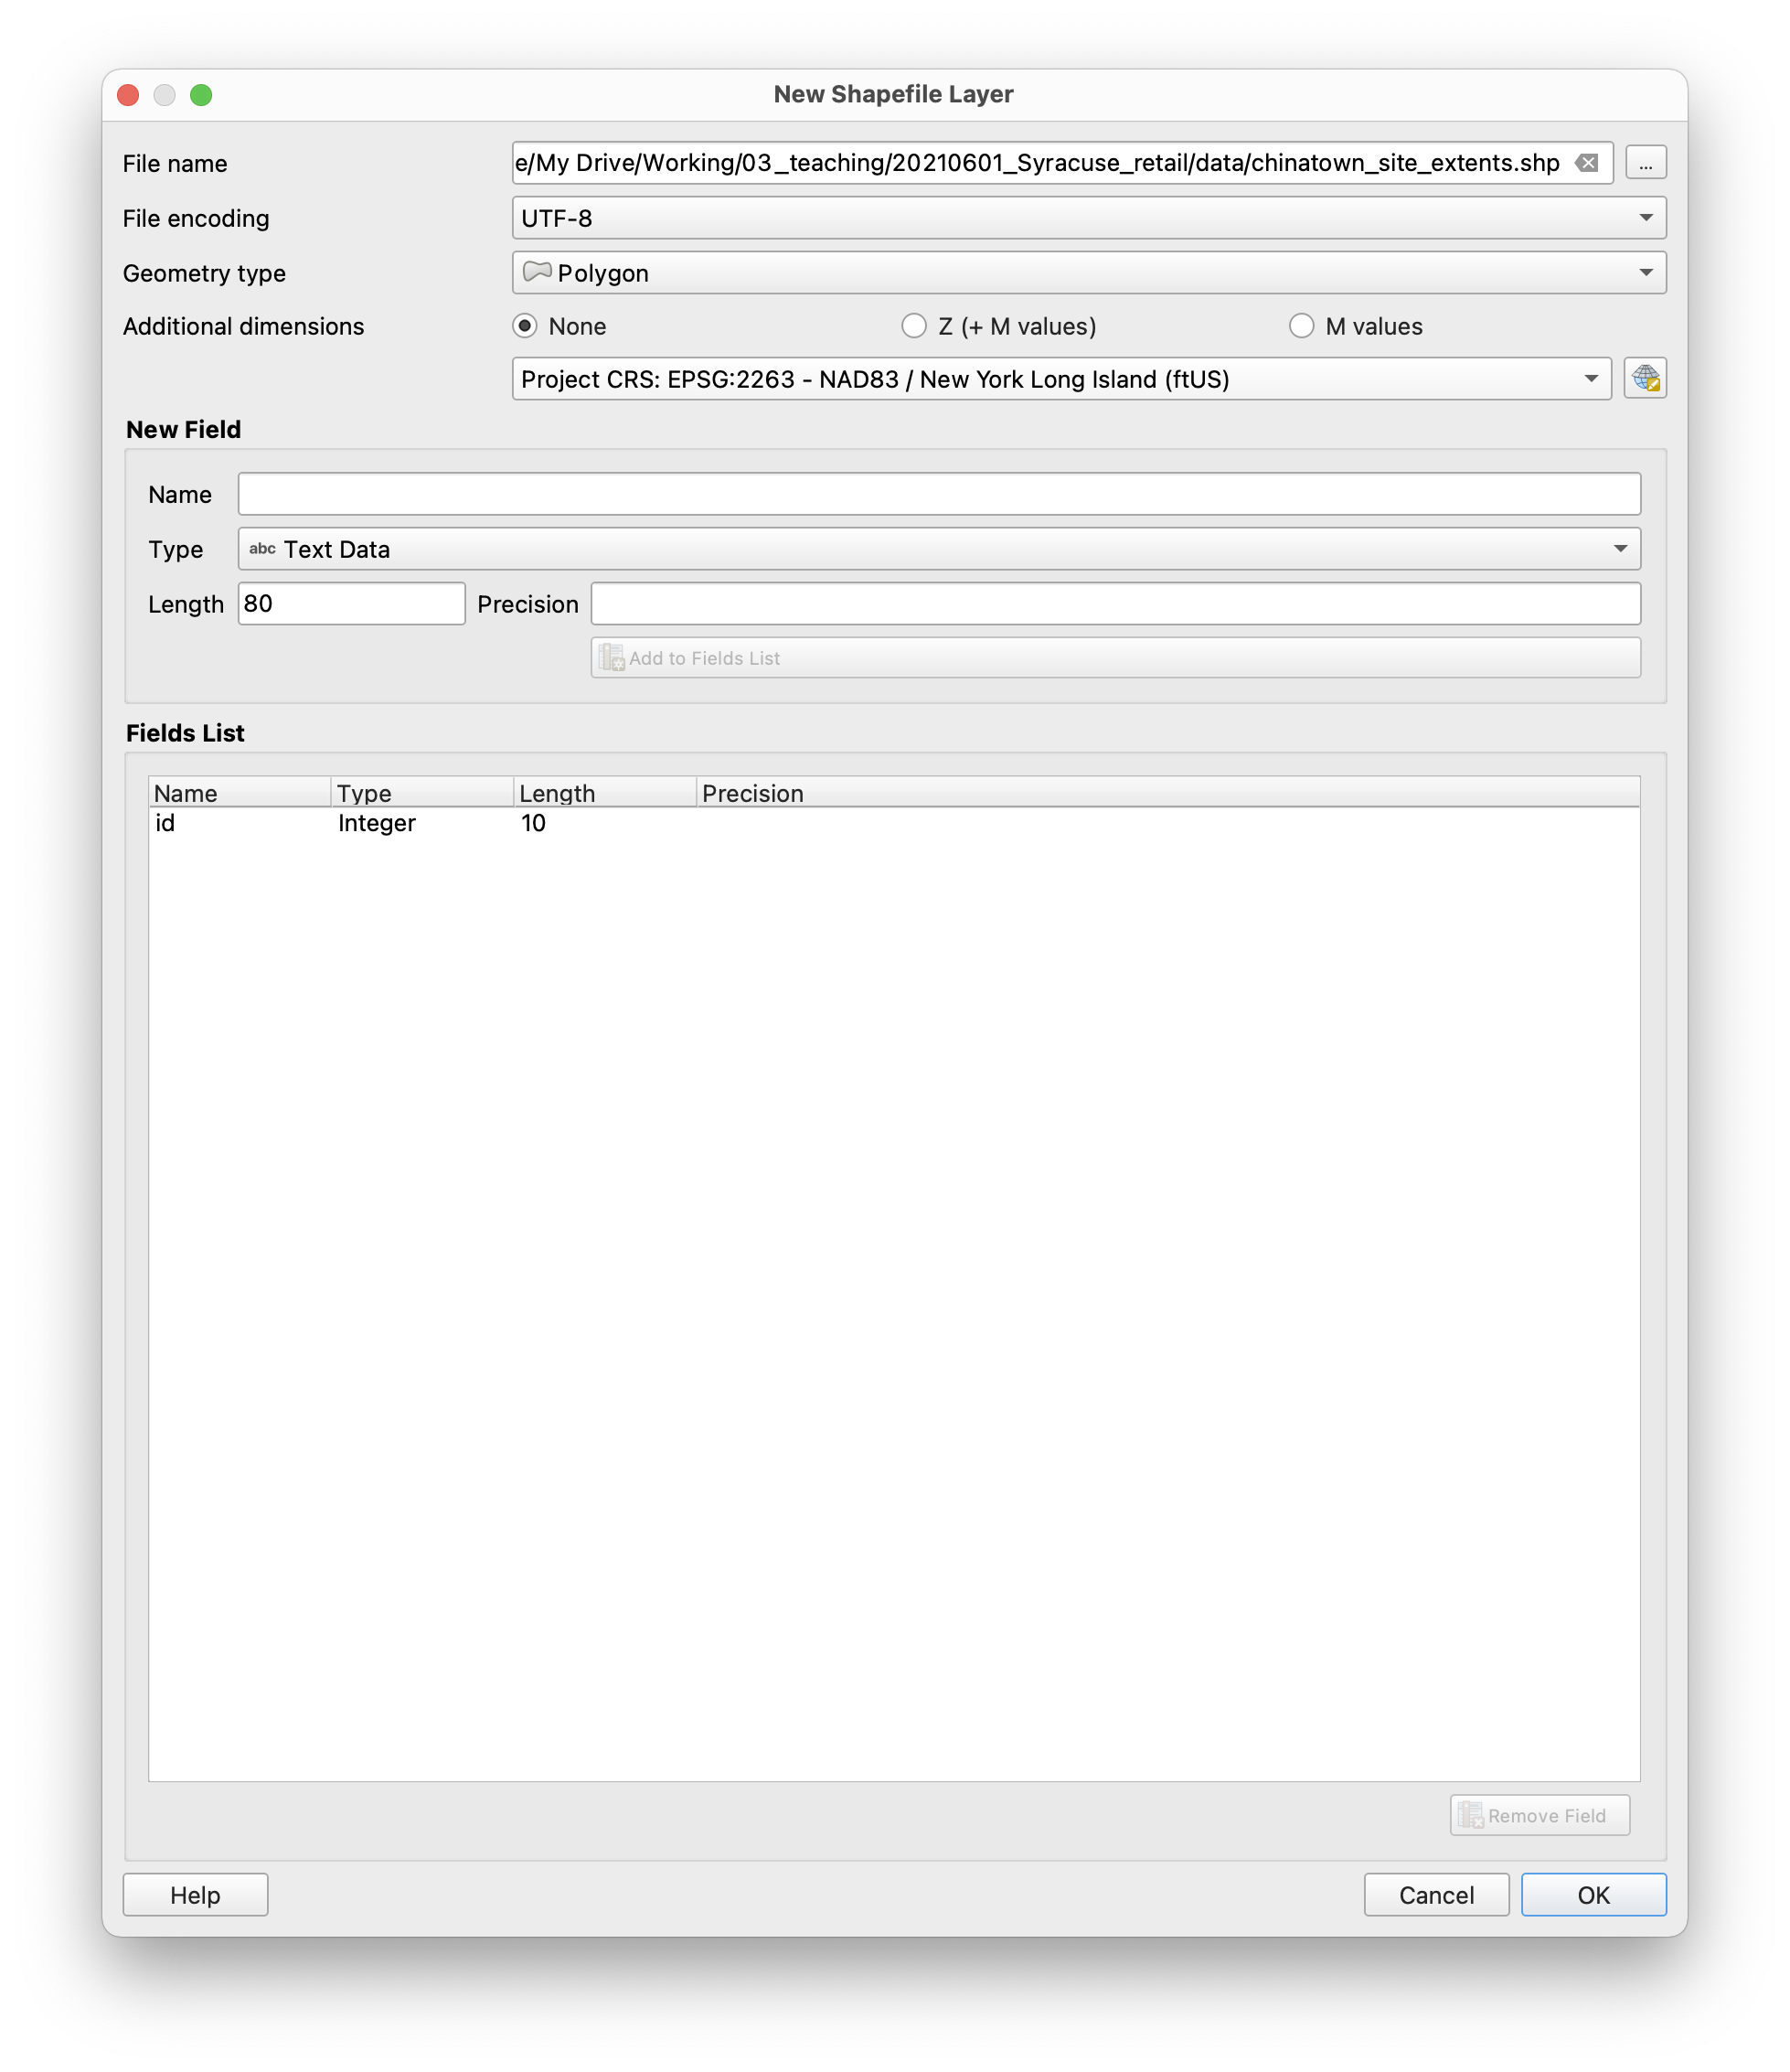
Toggle editing mode by selecting the pencil icon. Then use the Add polygon feature button and draw a polygon that covers canal street on the west side and your desired extents beyond:
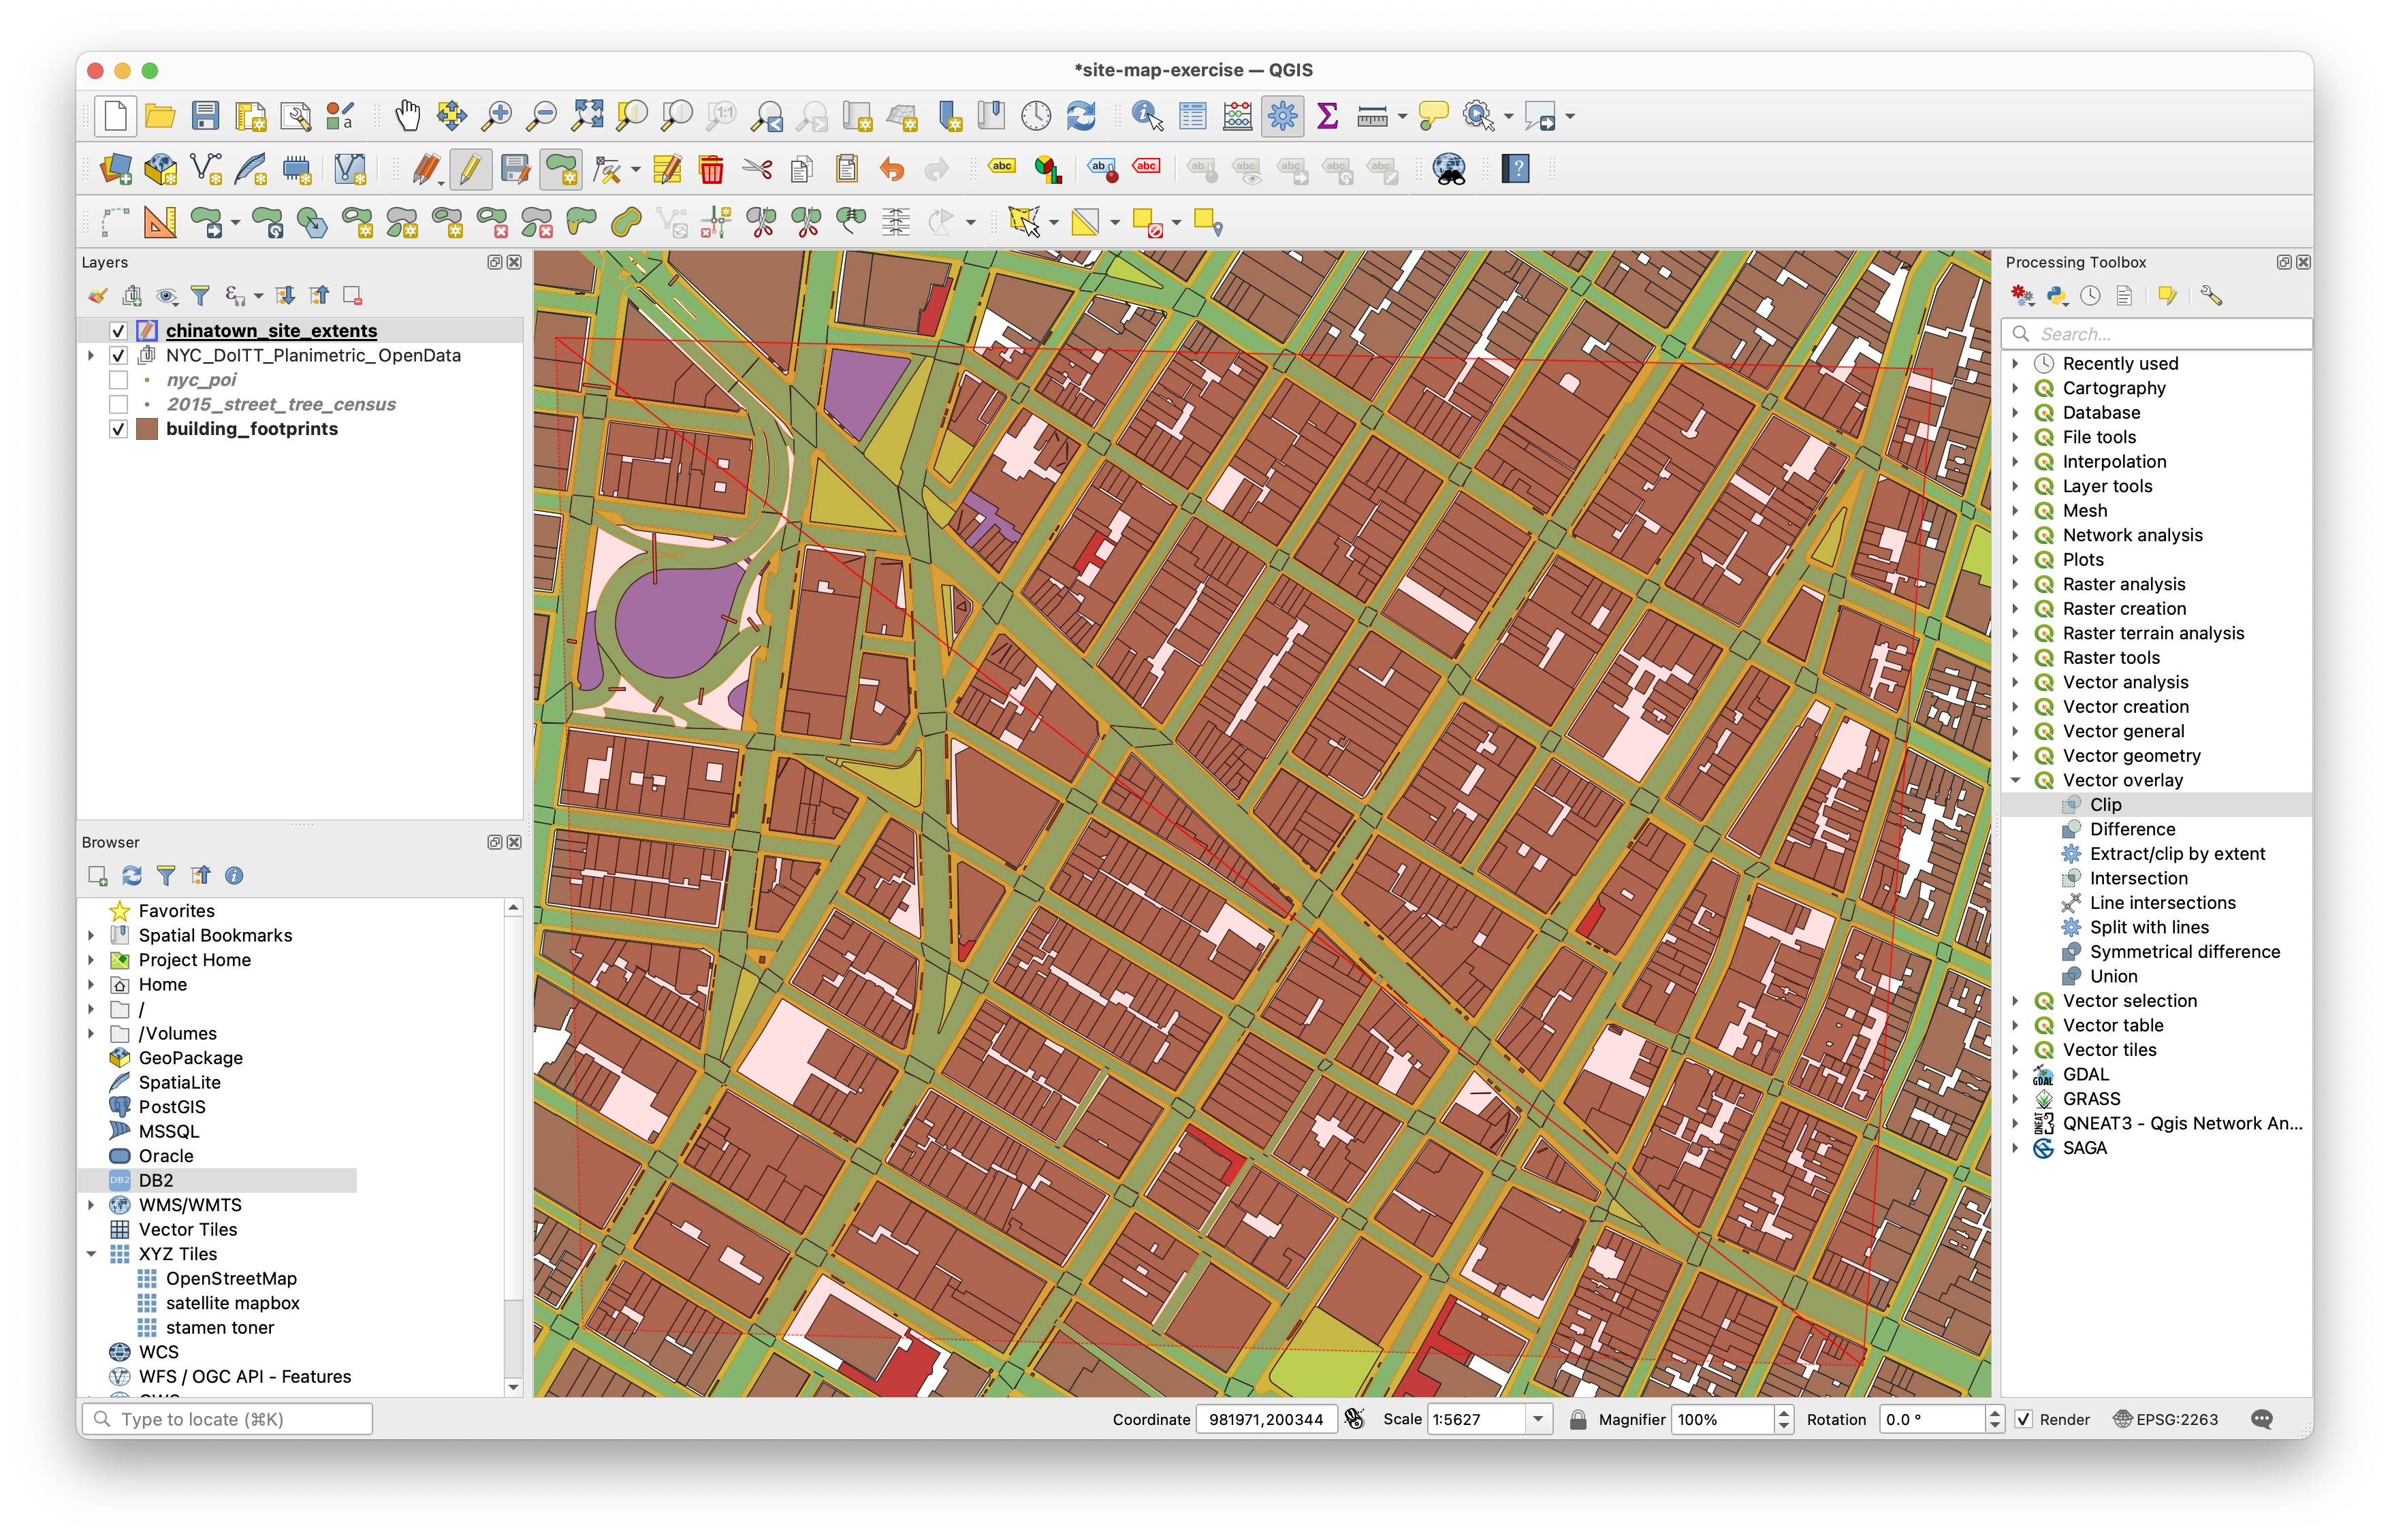
When you have finished drawing the rectangle right click to finish the polygon. Enter any ID number for this area. You should now have a rectangle showing the extents. Toggle off editing mode and click save.
Now we will use this new feature to select just those NYC Points of Interest / businesses that are within our area of focus.
To do this we will use a tool called Select by Location. Open this tool either with the Select by Location button in the toolbar or by searching for it in the Processing Toolbox. Make the following selections:
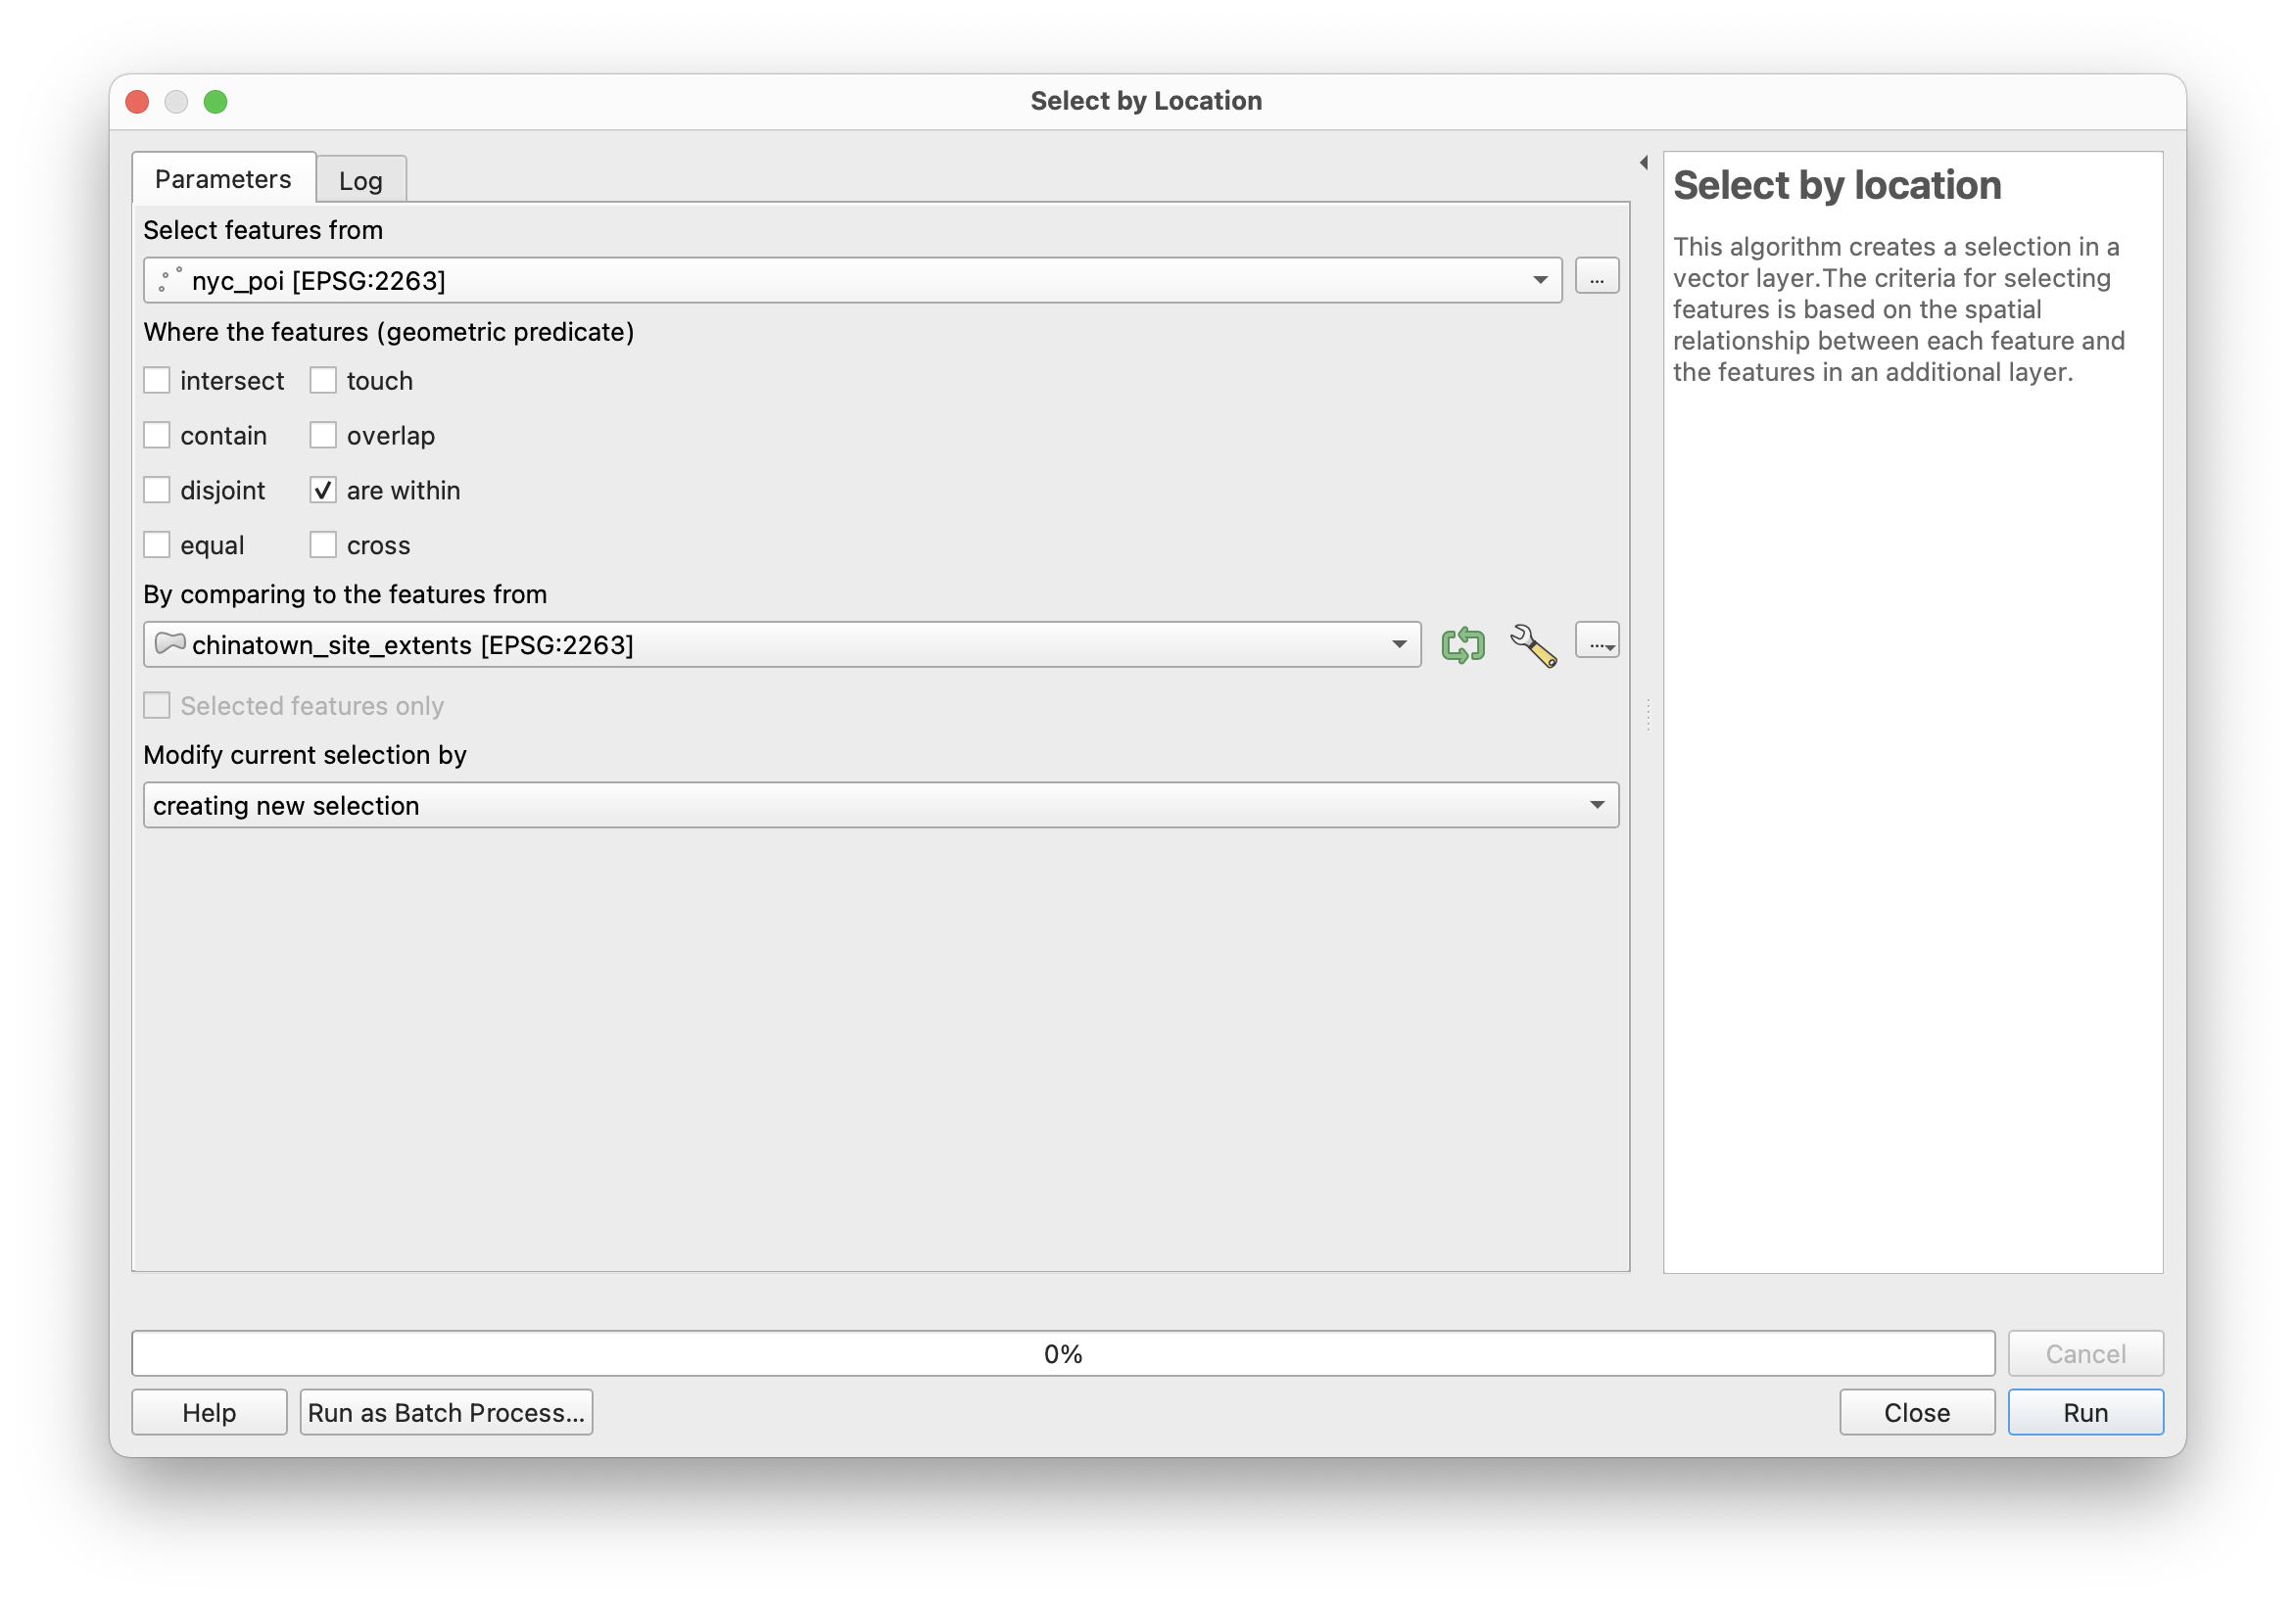
Click Run. (this may take a minute).
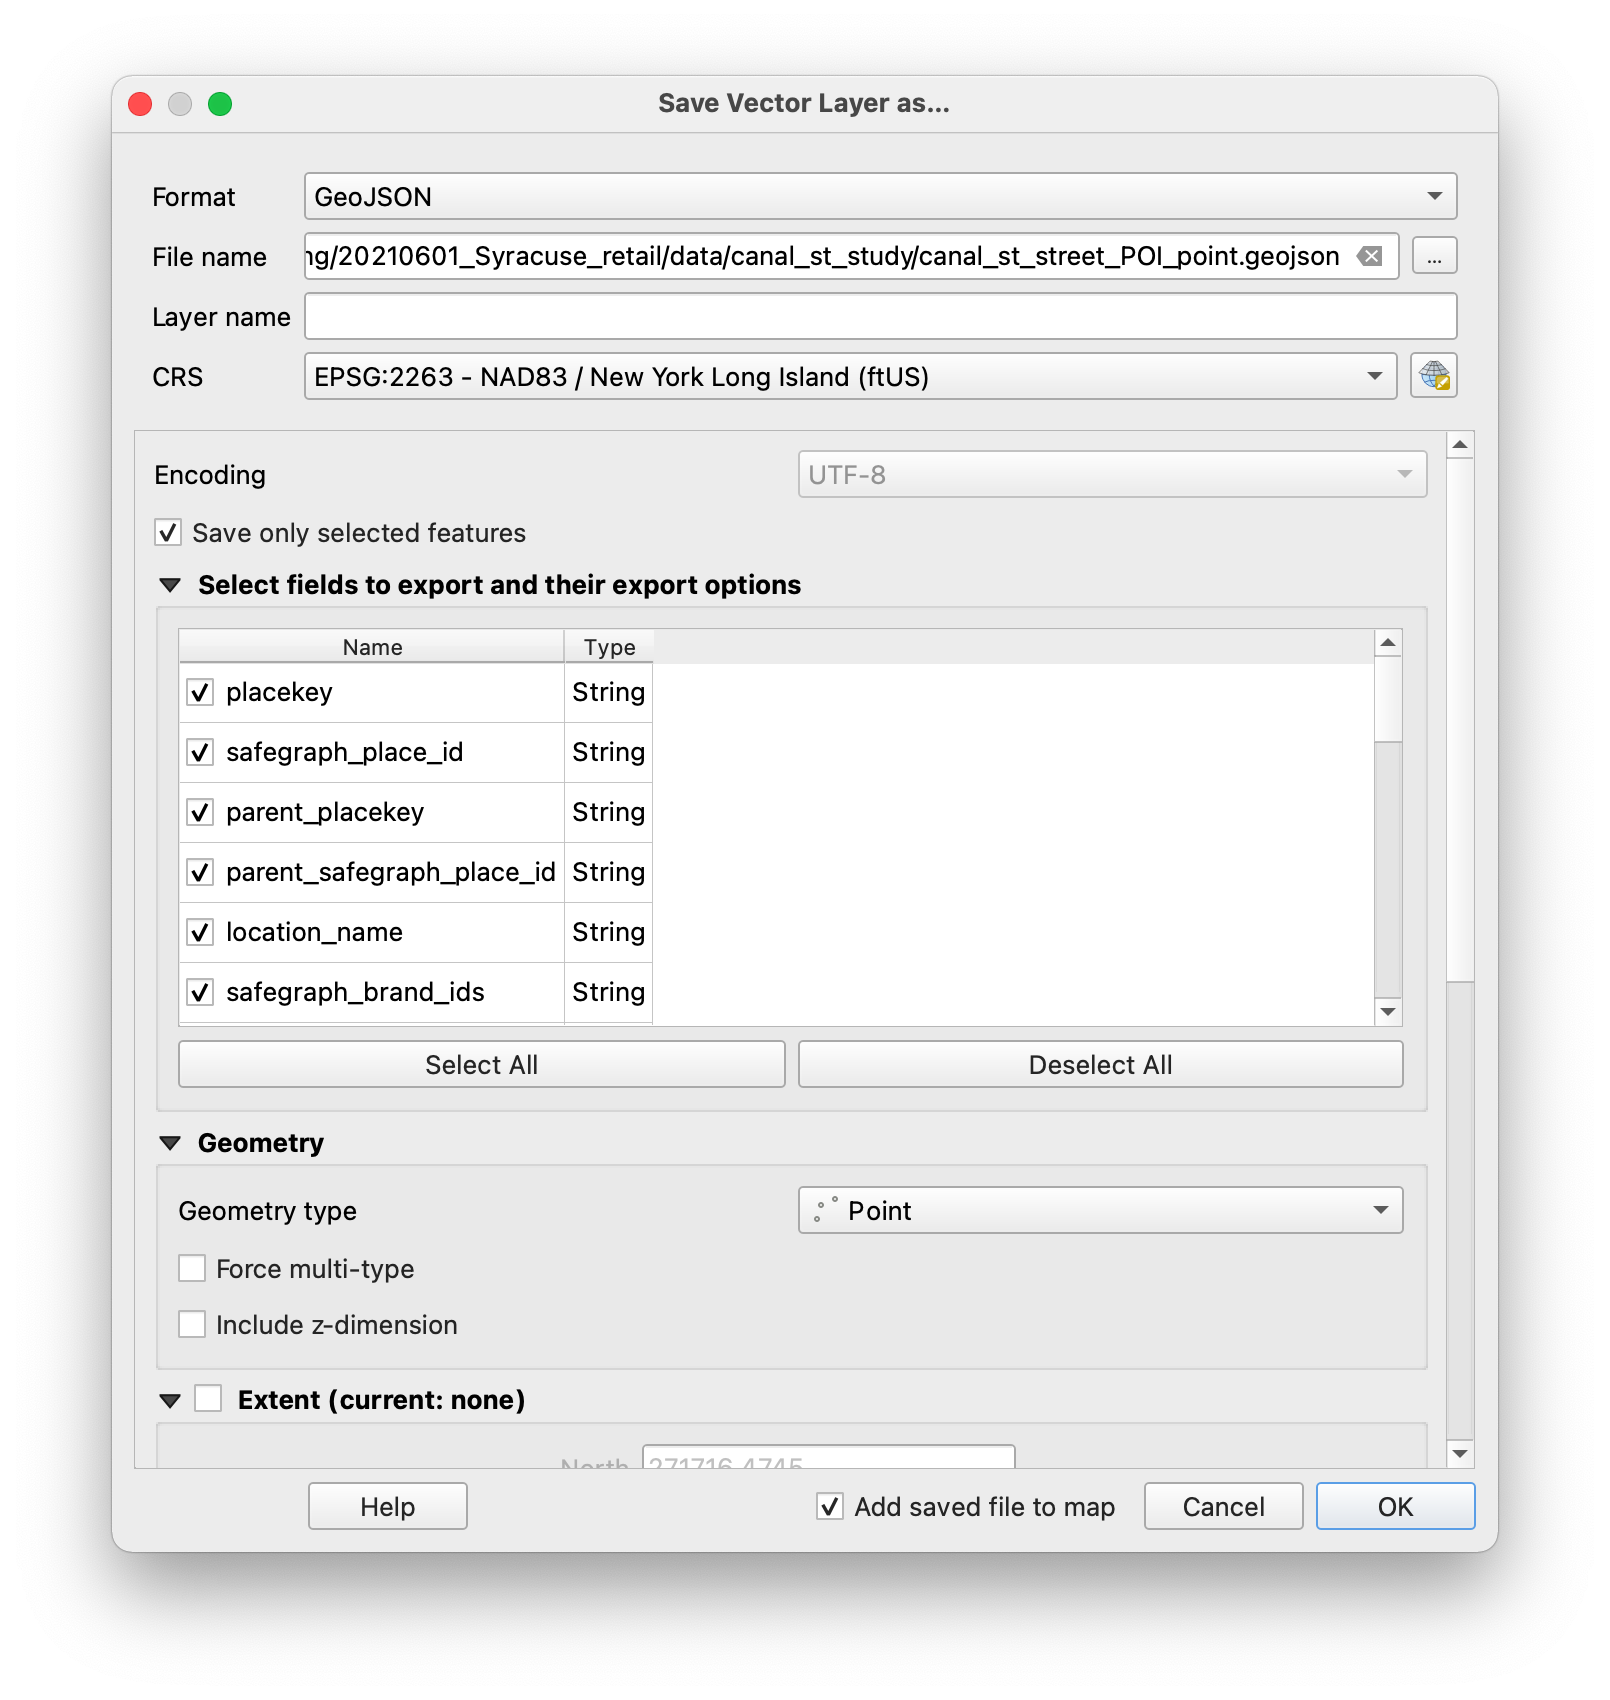
Once the selection finishes we will export the selected features as a new dataset.
Right click on the NYC_poi dataset in the Layers Panel. Export>Save Selected Features As. Make the following selections and choose a directory in which to save your data (you might want to make a new folder within the data folder called “canal_study”).
Repeat the same process but for the street trees.
Viewing attribute data
GIS data is unique in that it is composed of geometric/geographic information (what you see on the map) as well as associated attribute information. This is powerful because we can work with these two elements of the data together to uncover hidden or not previously visible information about our environments.
Lets take a look at some of the attribute information available for the datasets we are working with.
Right click on the canal street trees layer in the layers panel. Select Open Attribute Table
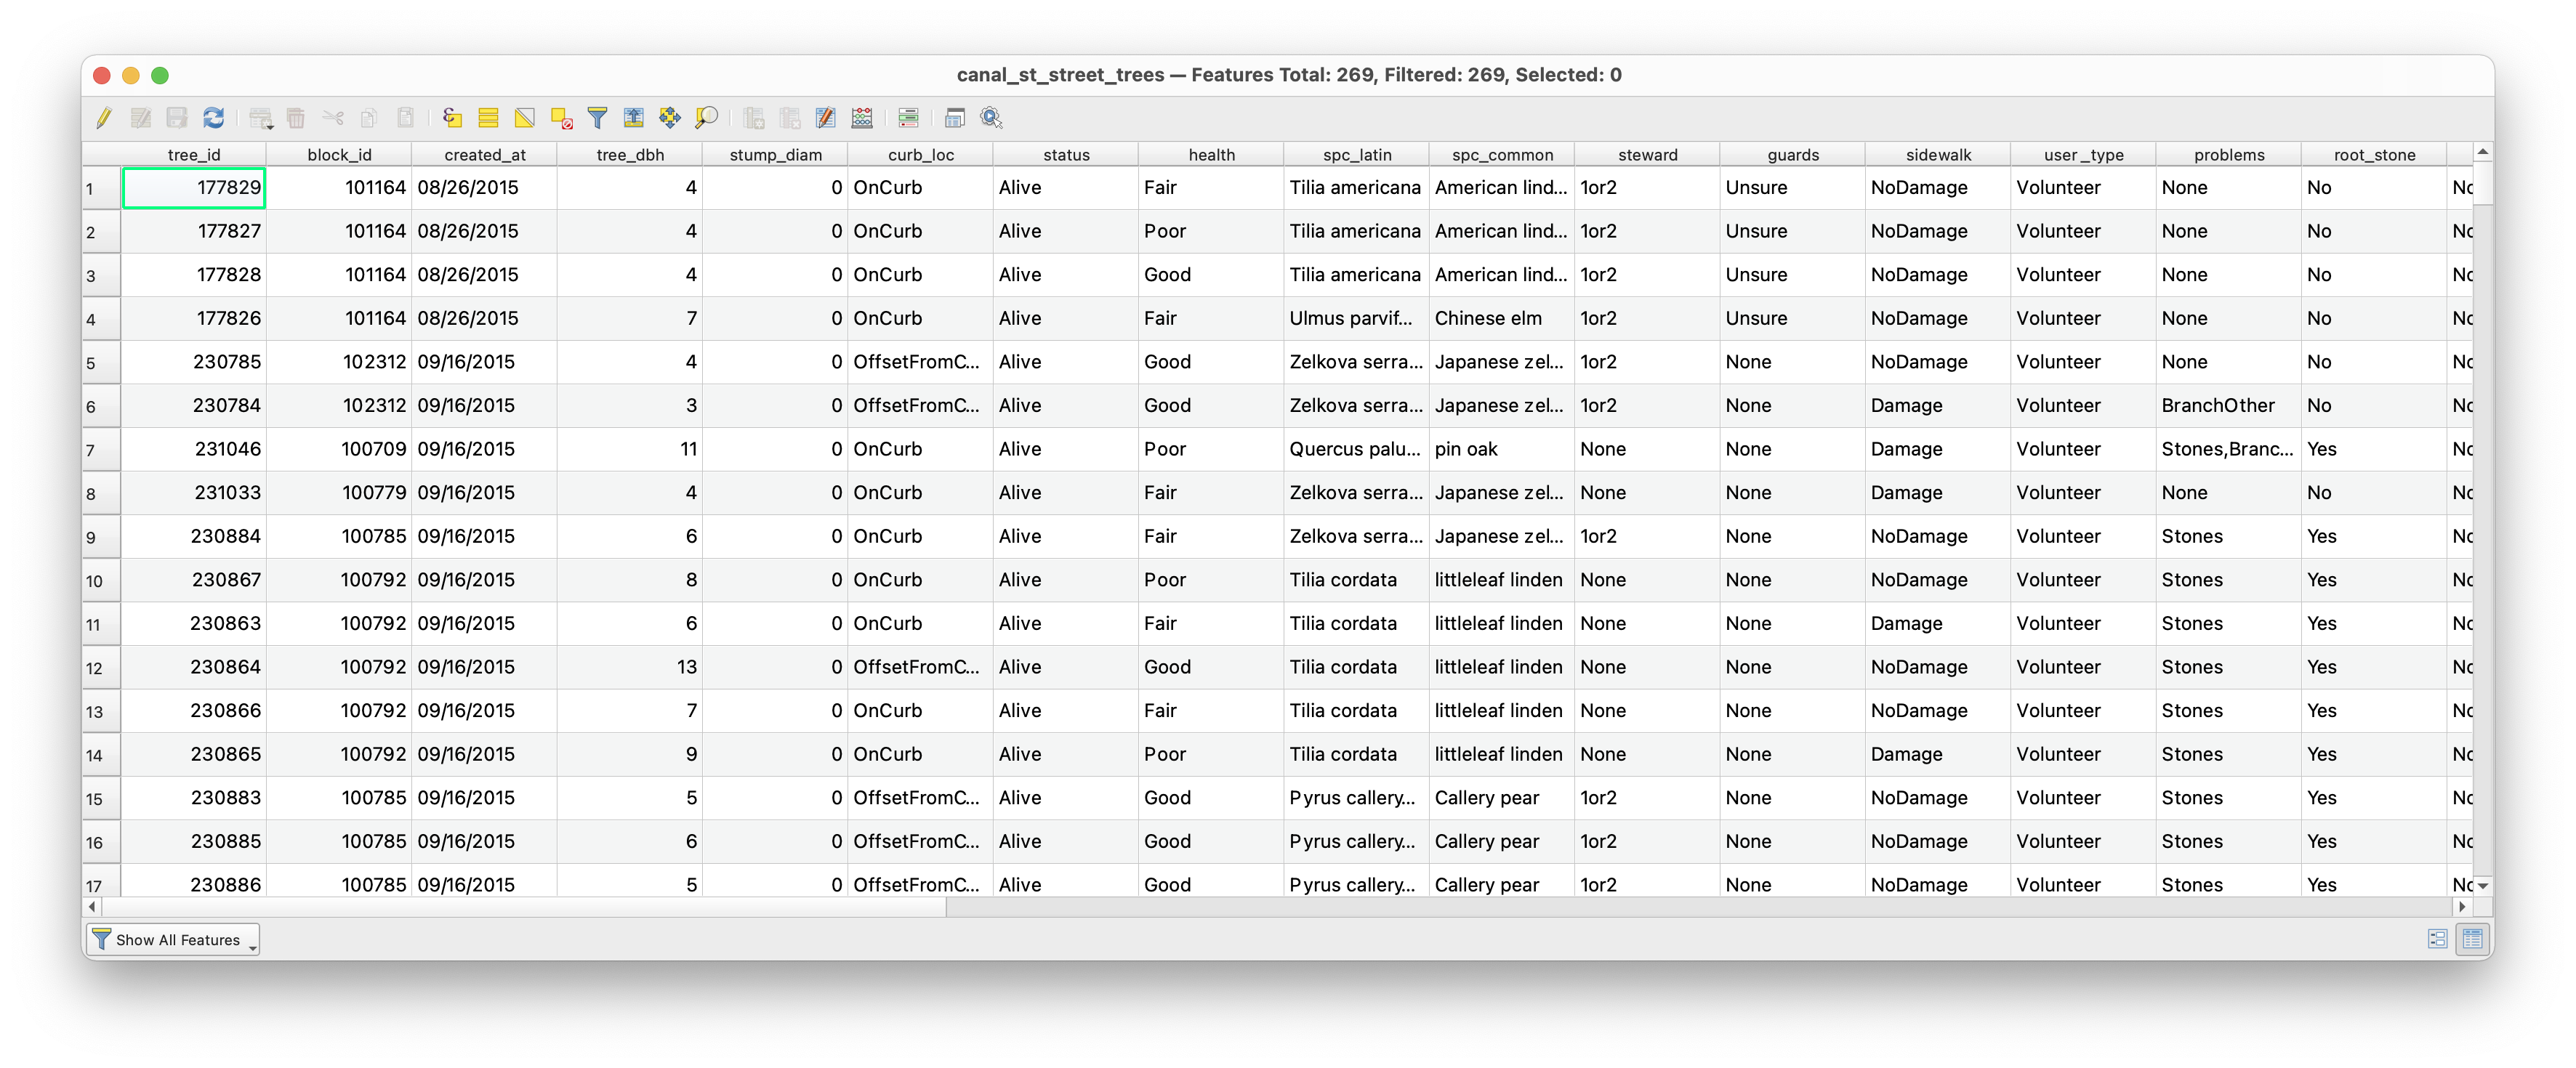
Inspect the fields that are visible here. For more information about what information each column contains review the codebook released with this dataset
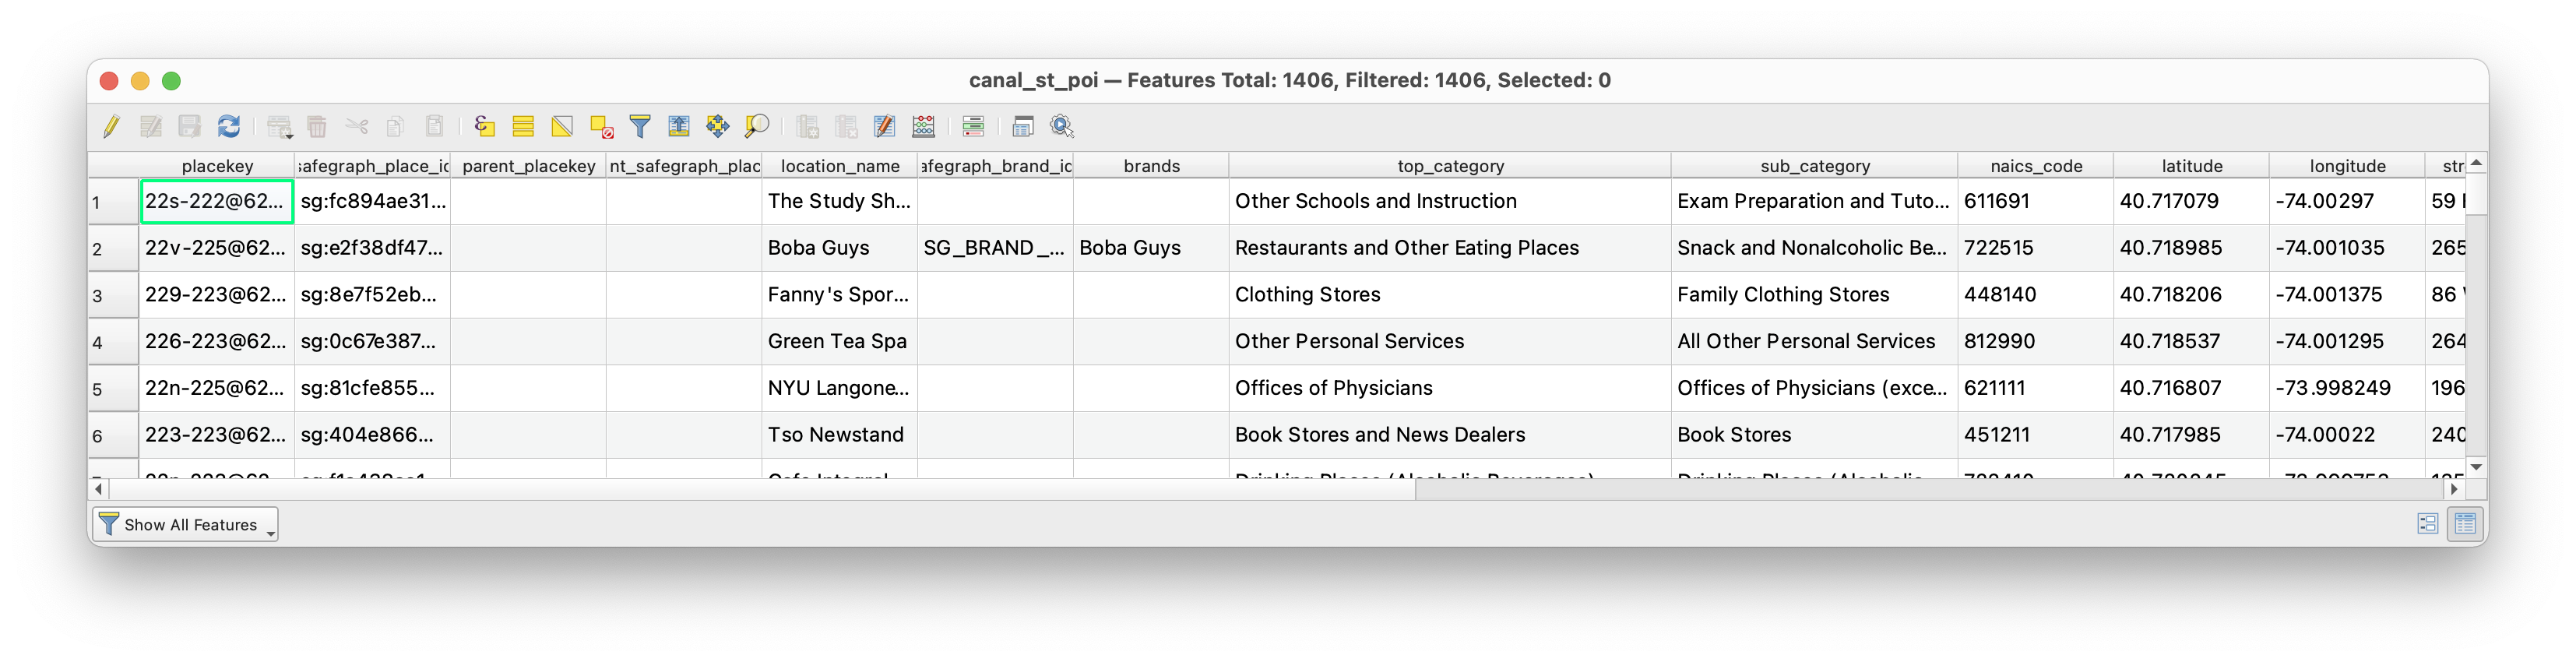
Do the same thing for the points of interest / businesses dataset:
 .
.
We will use the attributes of each of these layers to define how they get drawn (to define their symbology).
Defining layer symbology
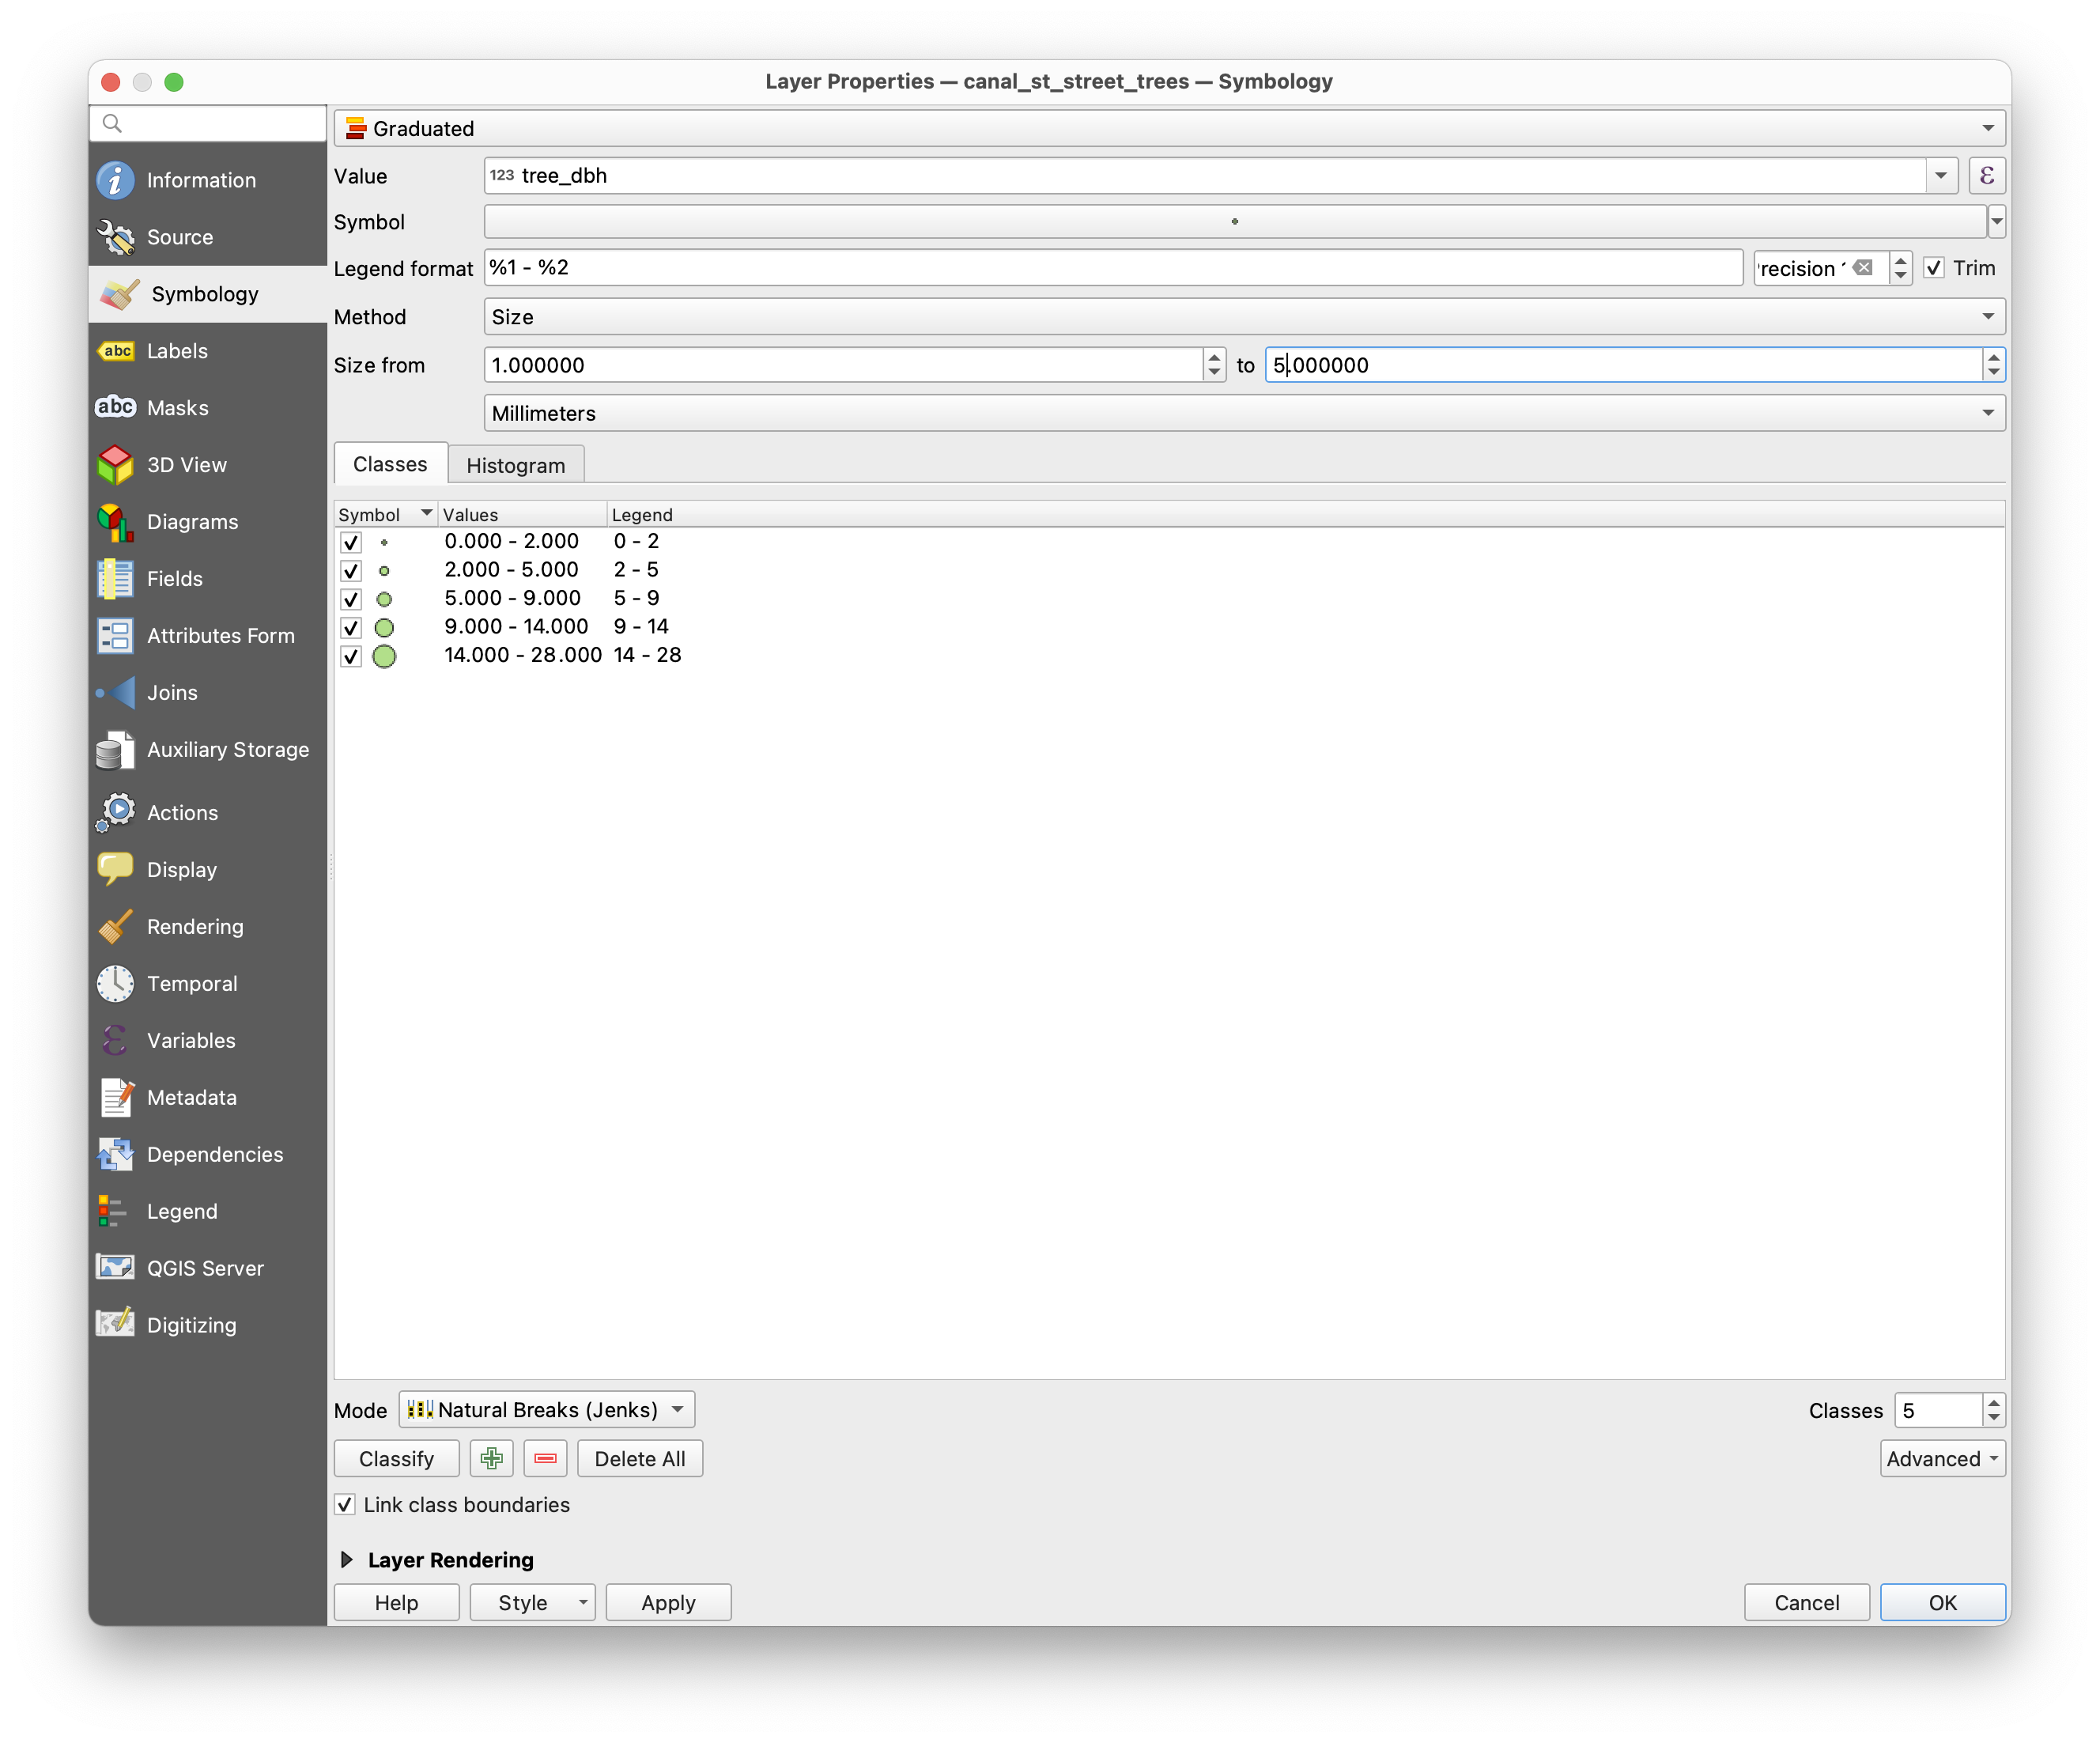
Open the Symbology menu for the street trees layer by right clicking on the layer name in the layers panel > Properties.
We will create a graduated symbol map where the size of the circle that is drawn for each tree is relative to the measured diameter of the tree. Make the following selection then click OK
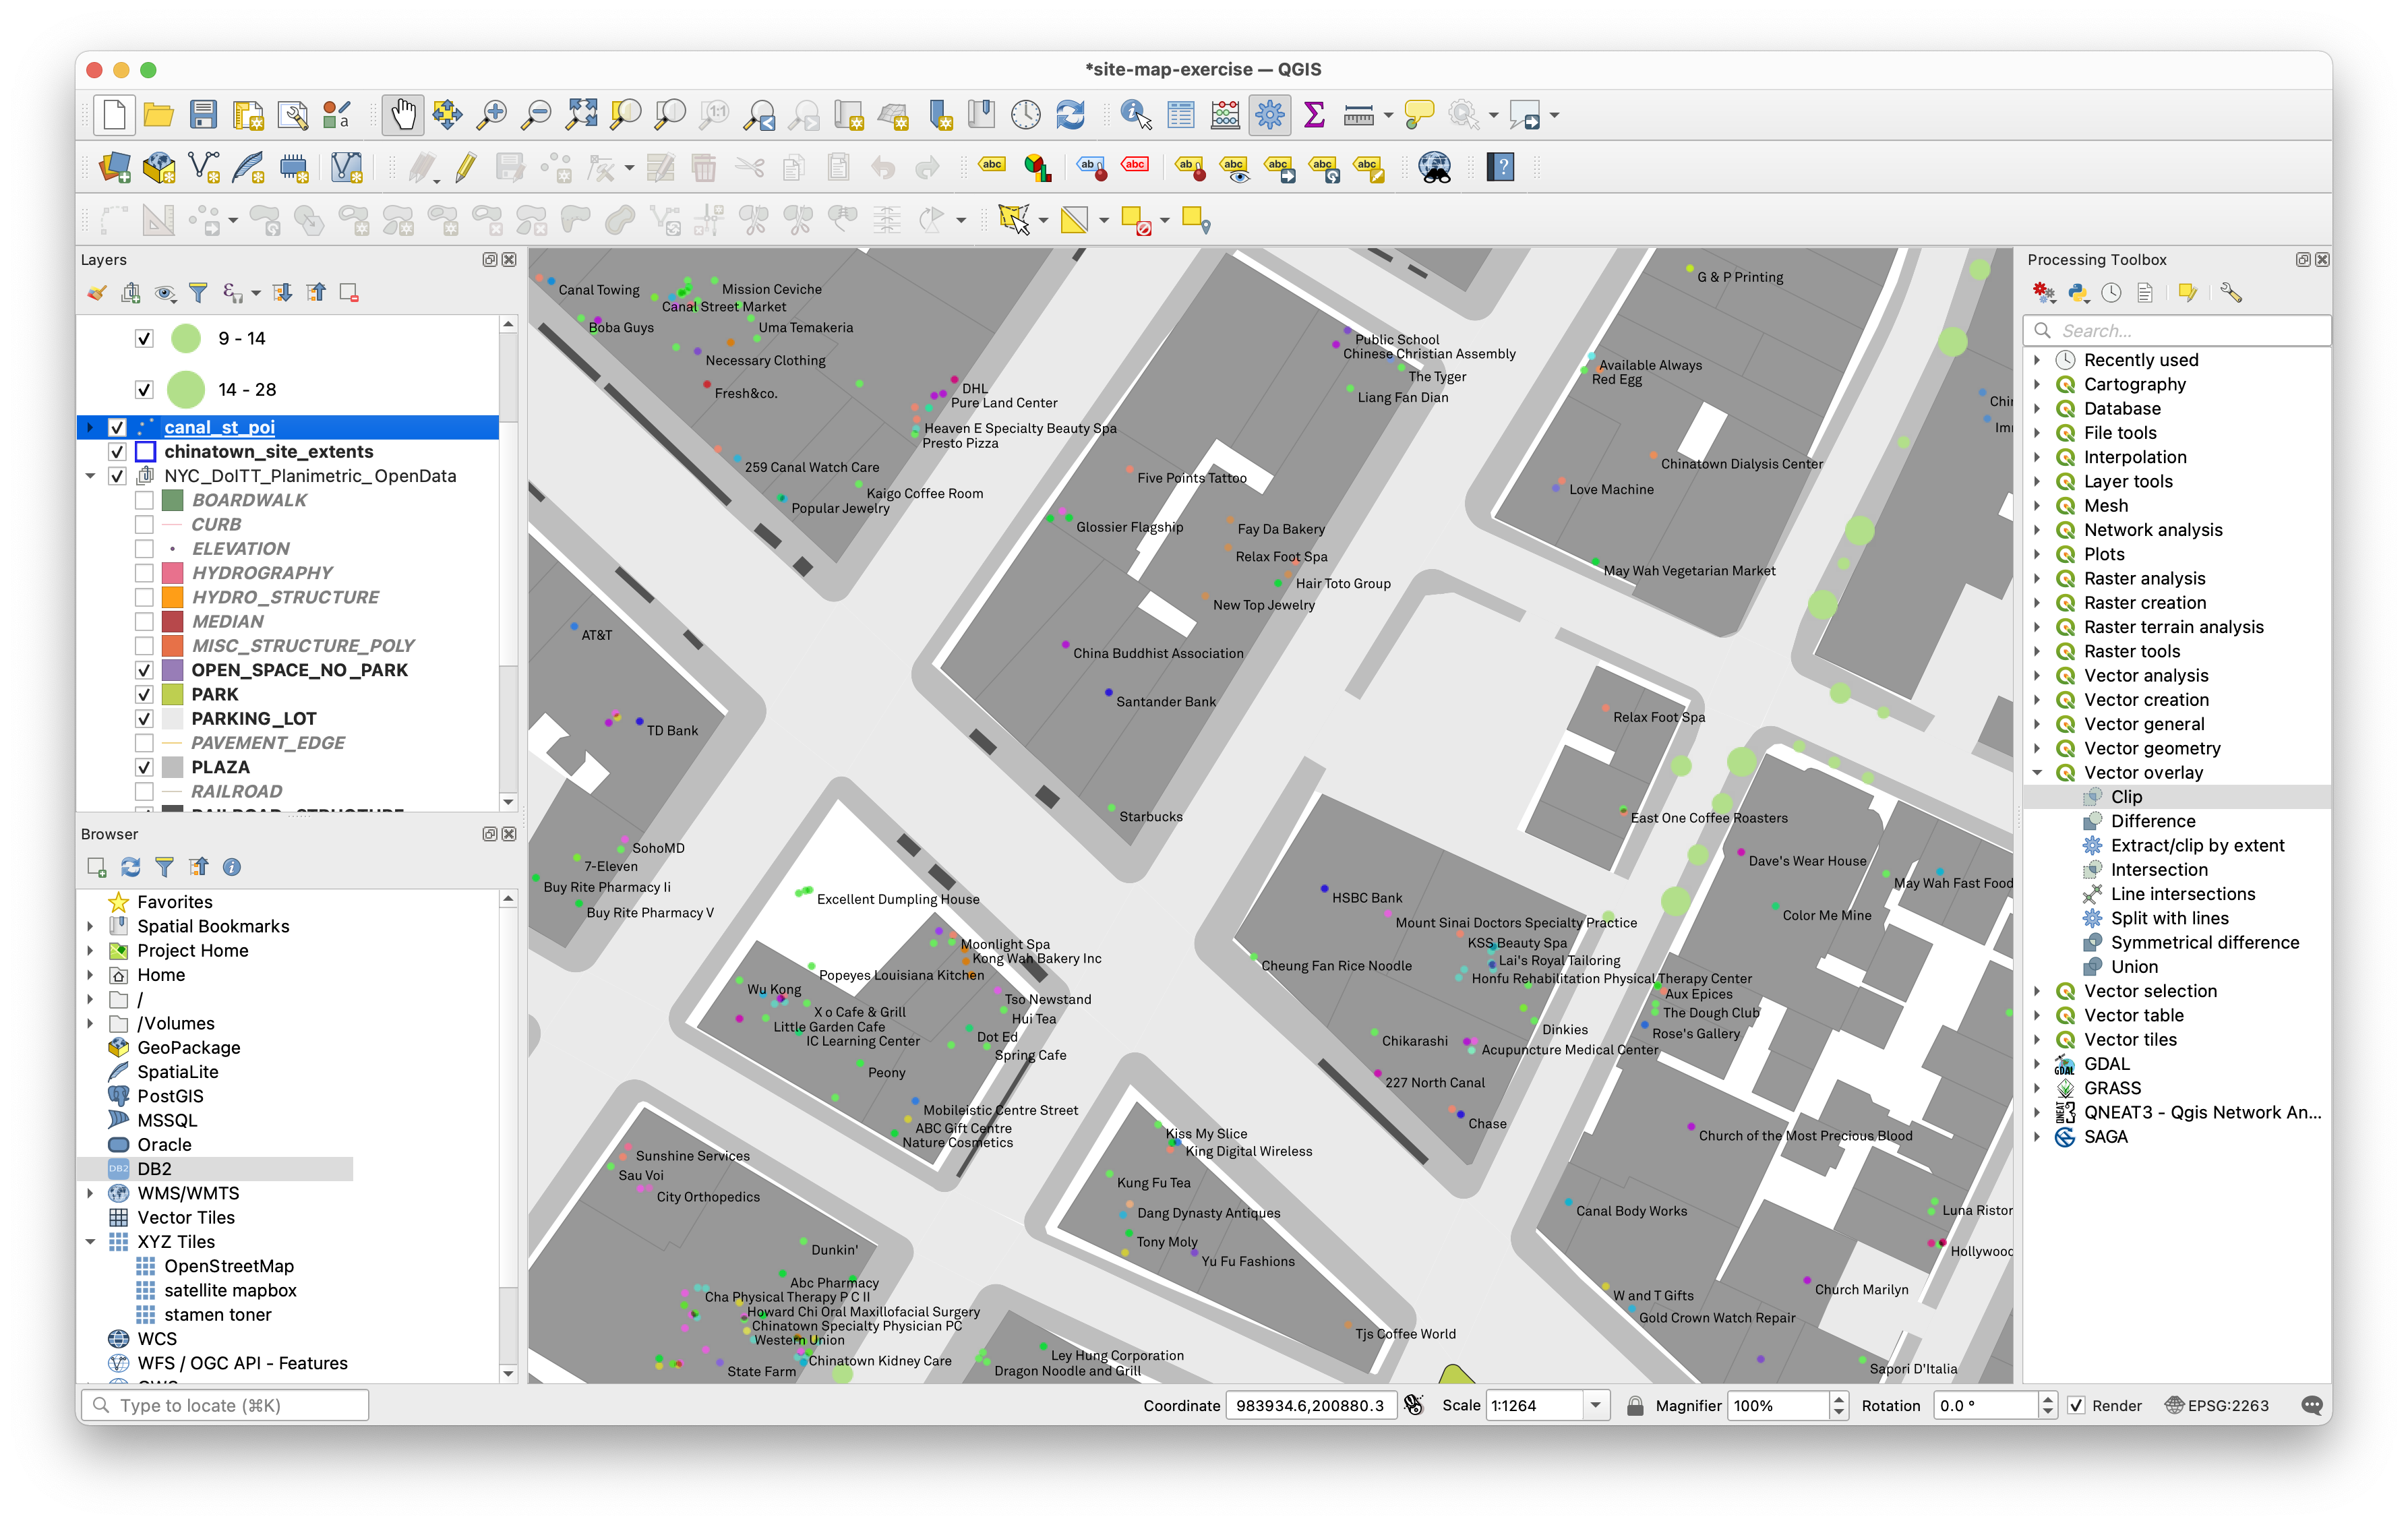
Now we will color the point of interest locations by the category of business they fall within. Open the symbology menu for the poi dataset. Select Categorized as the type of classification. Then make the following selections:
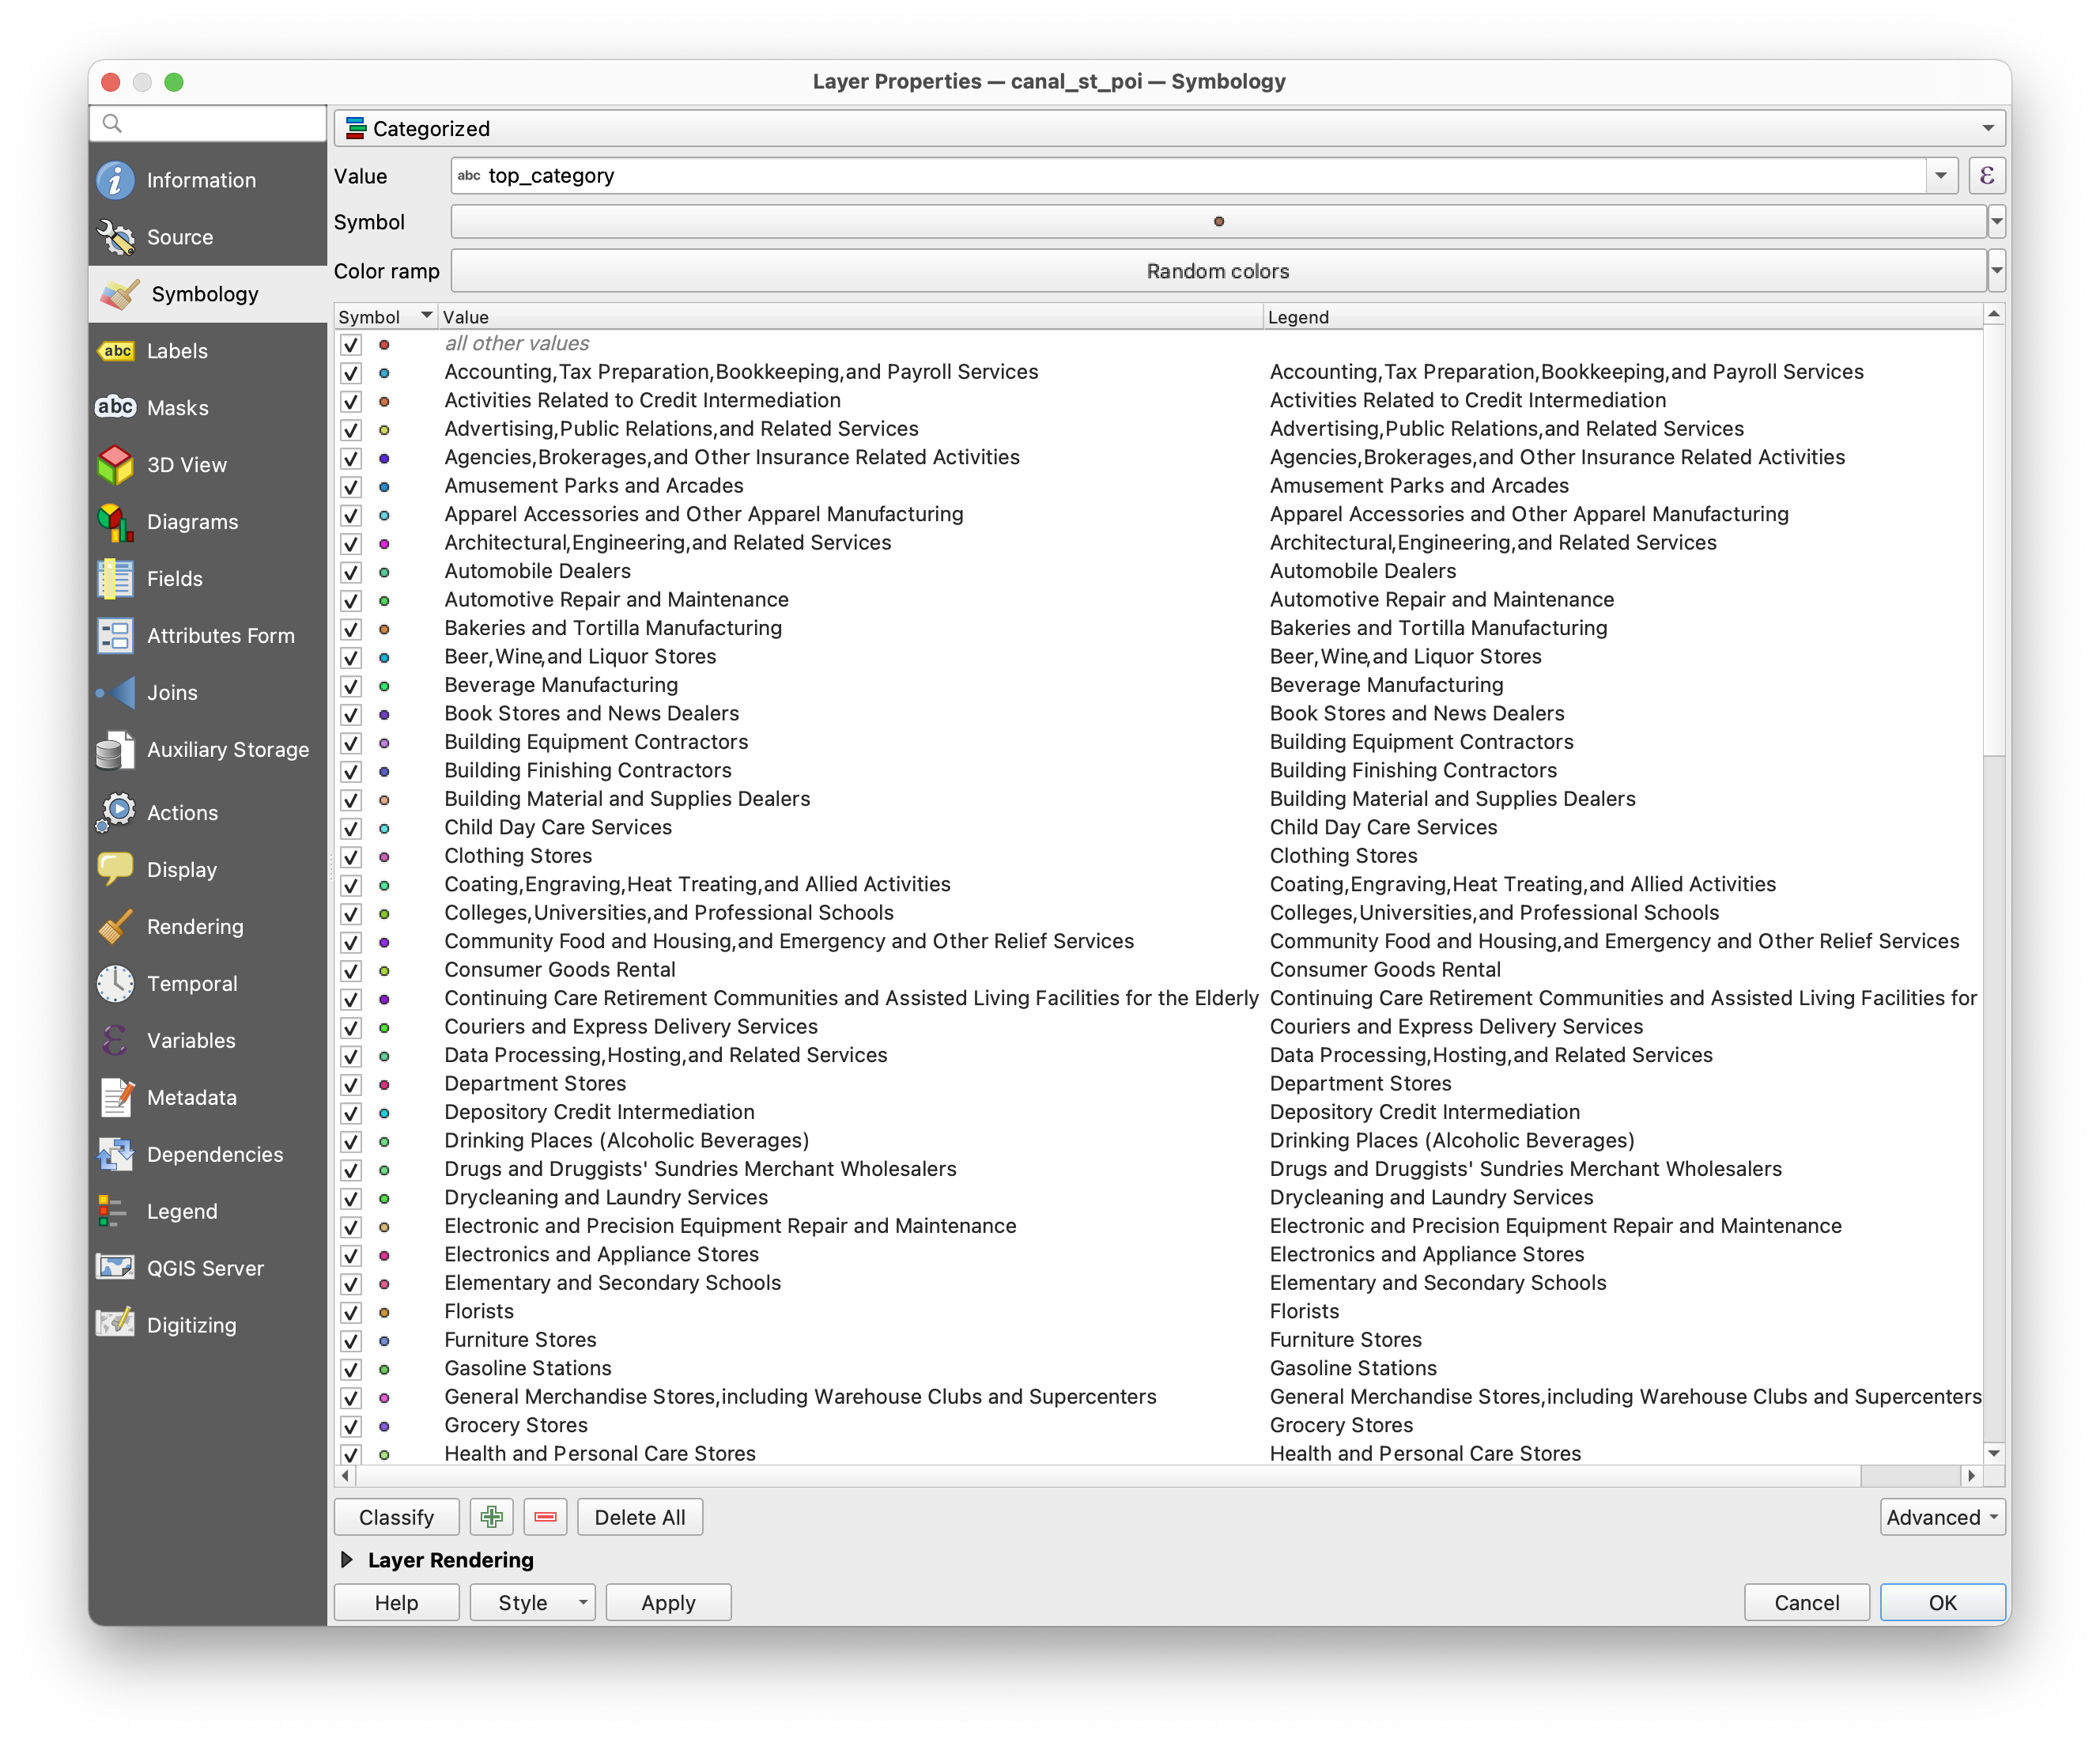
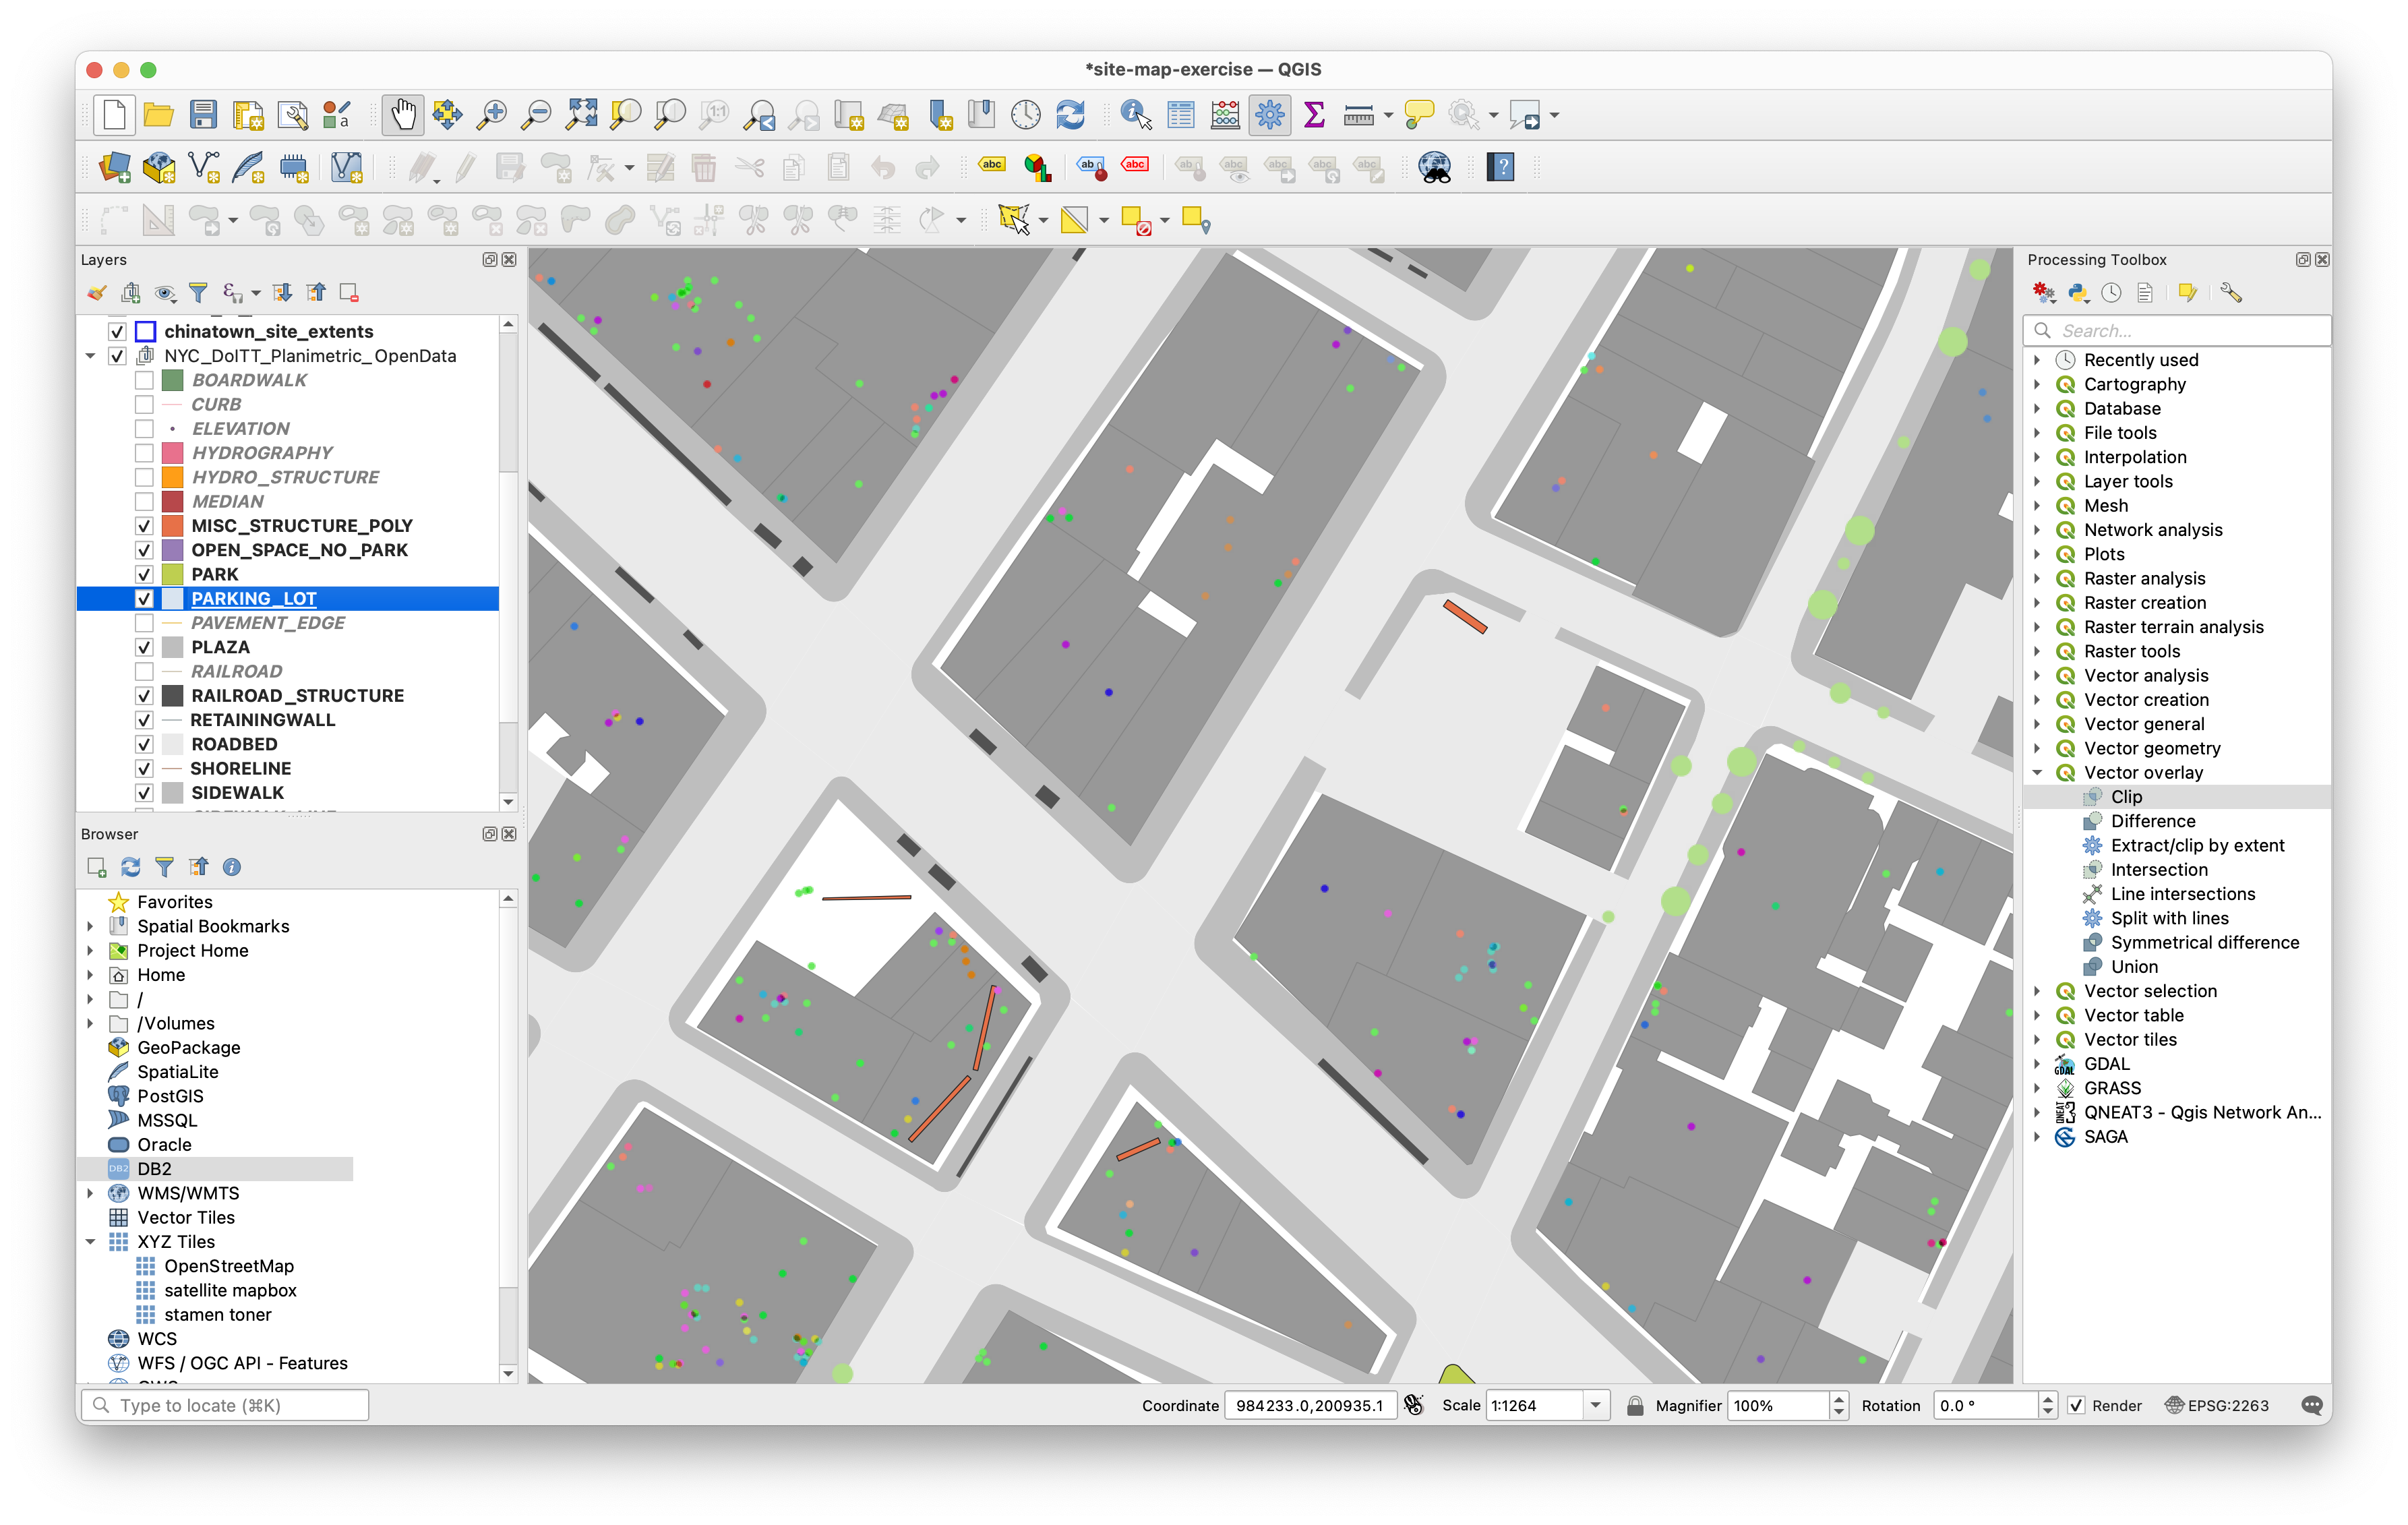
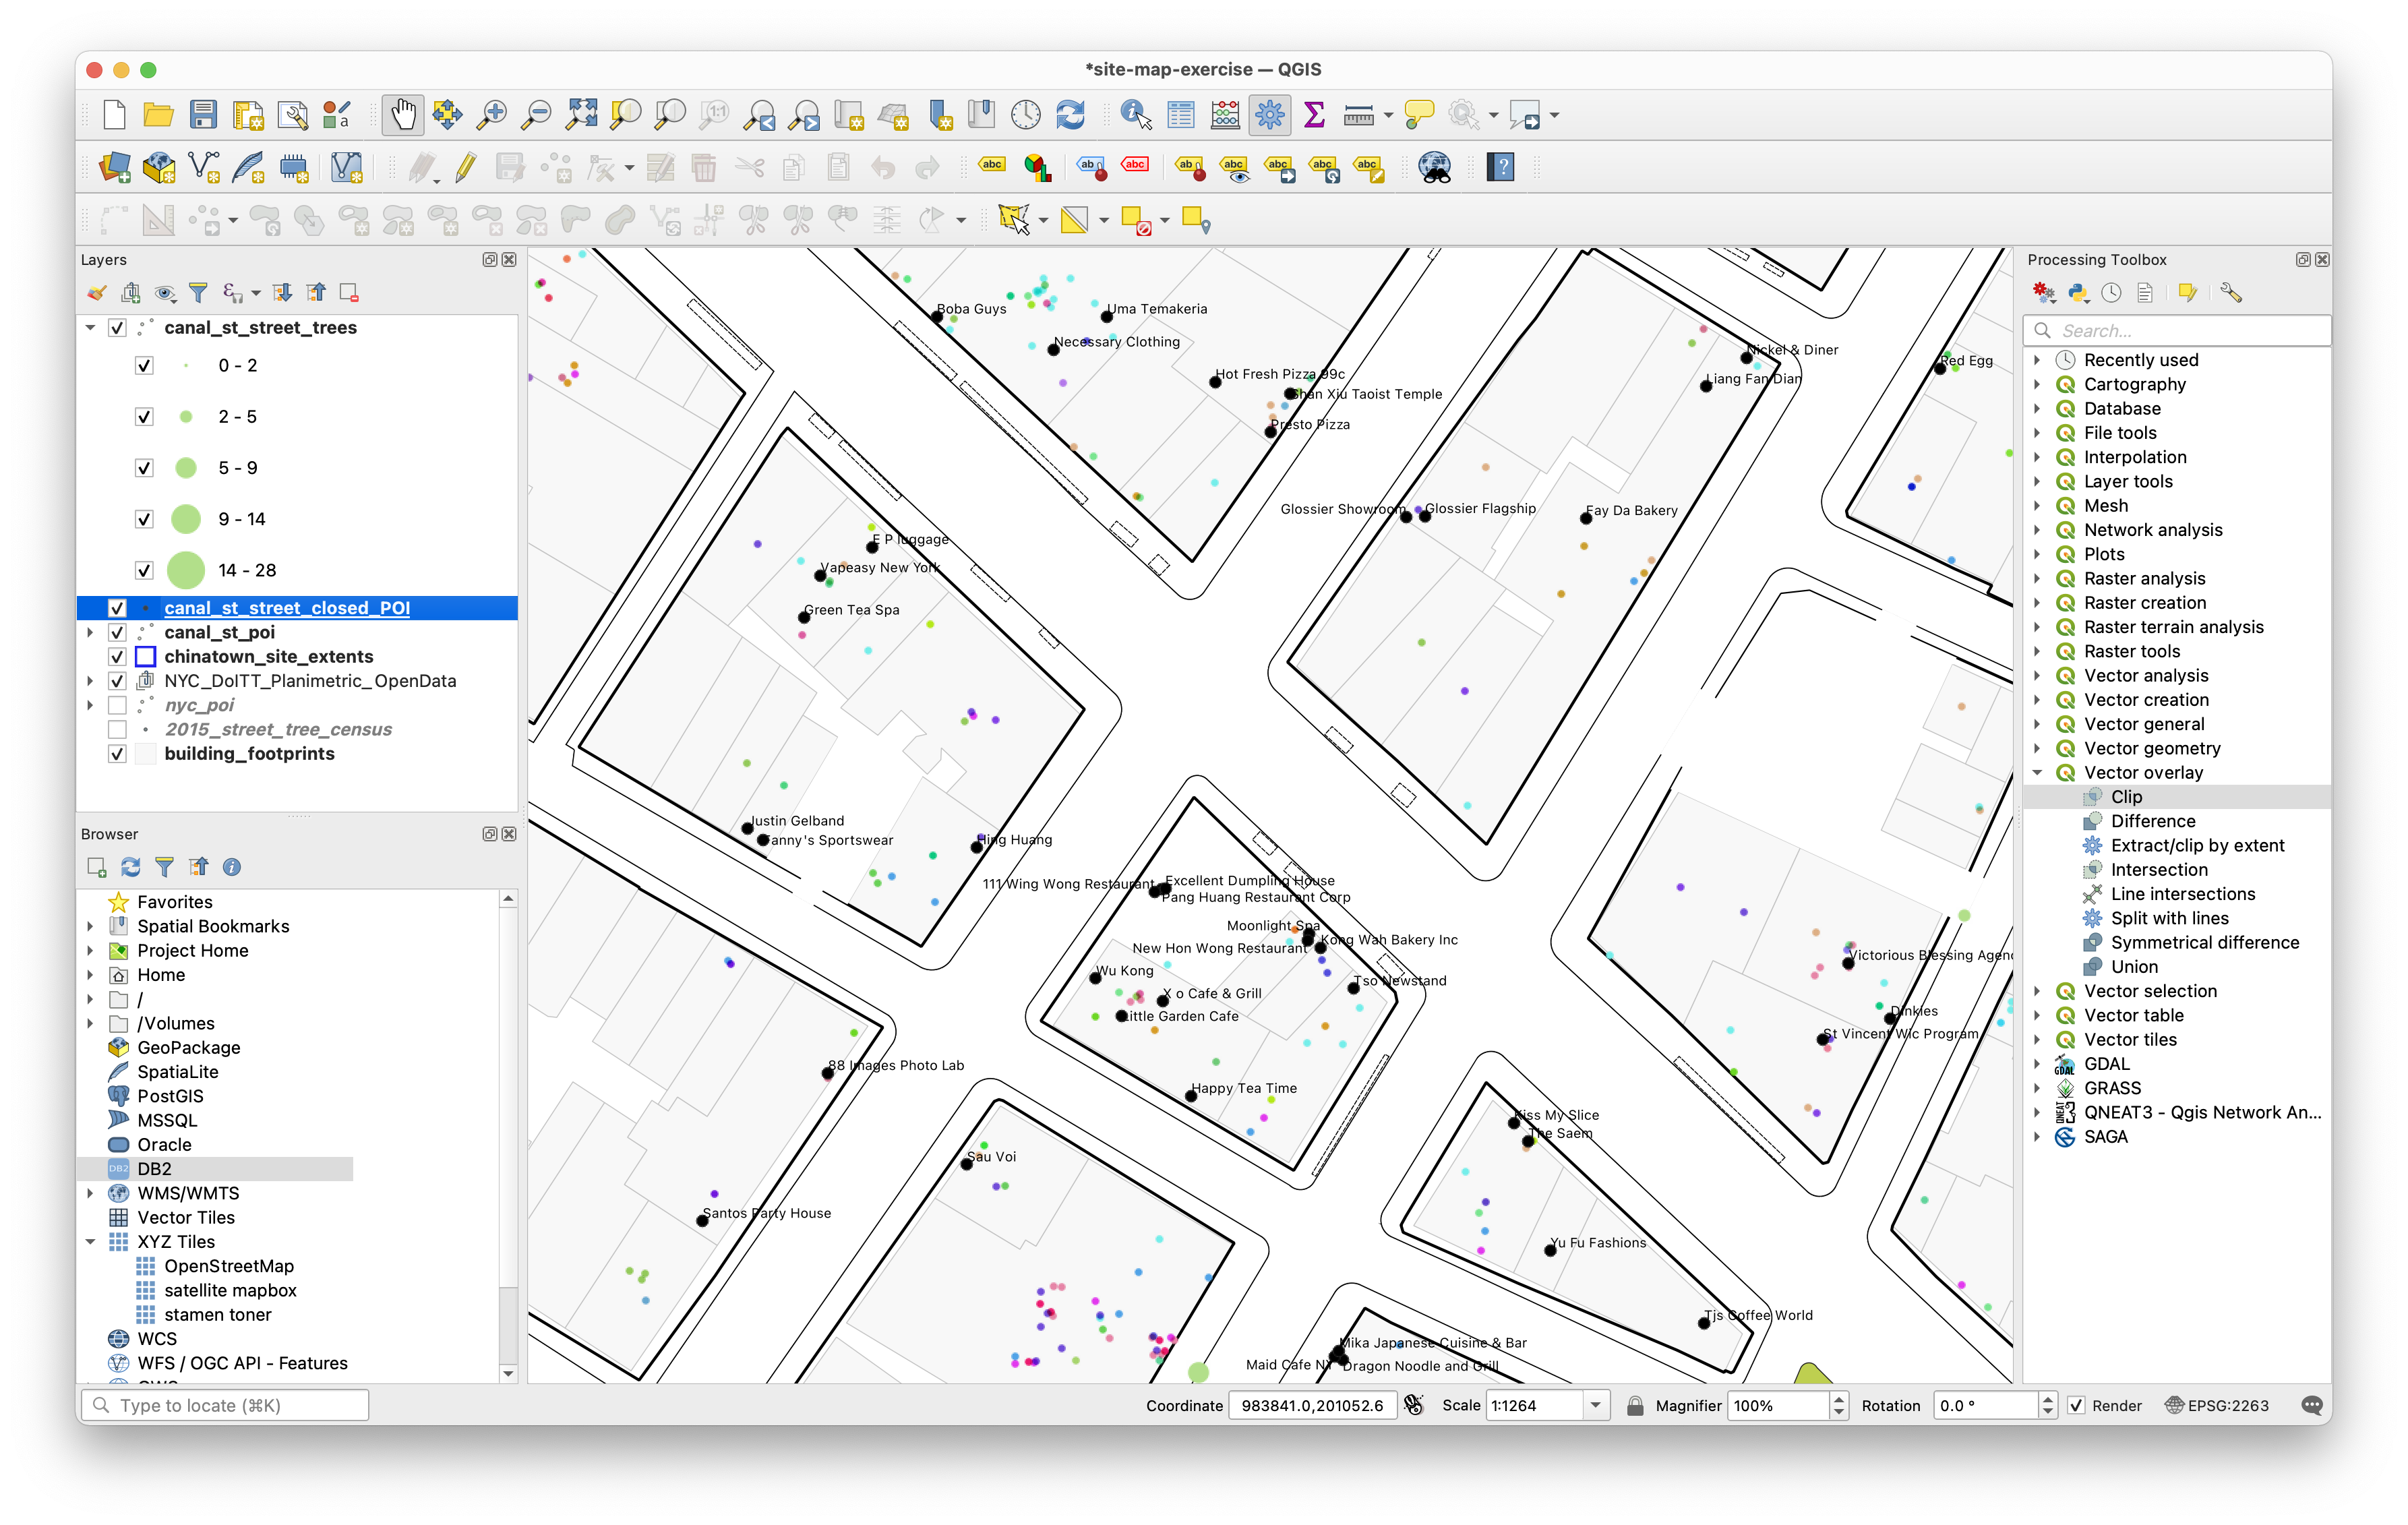
Your map should now look something like this:
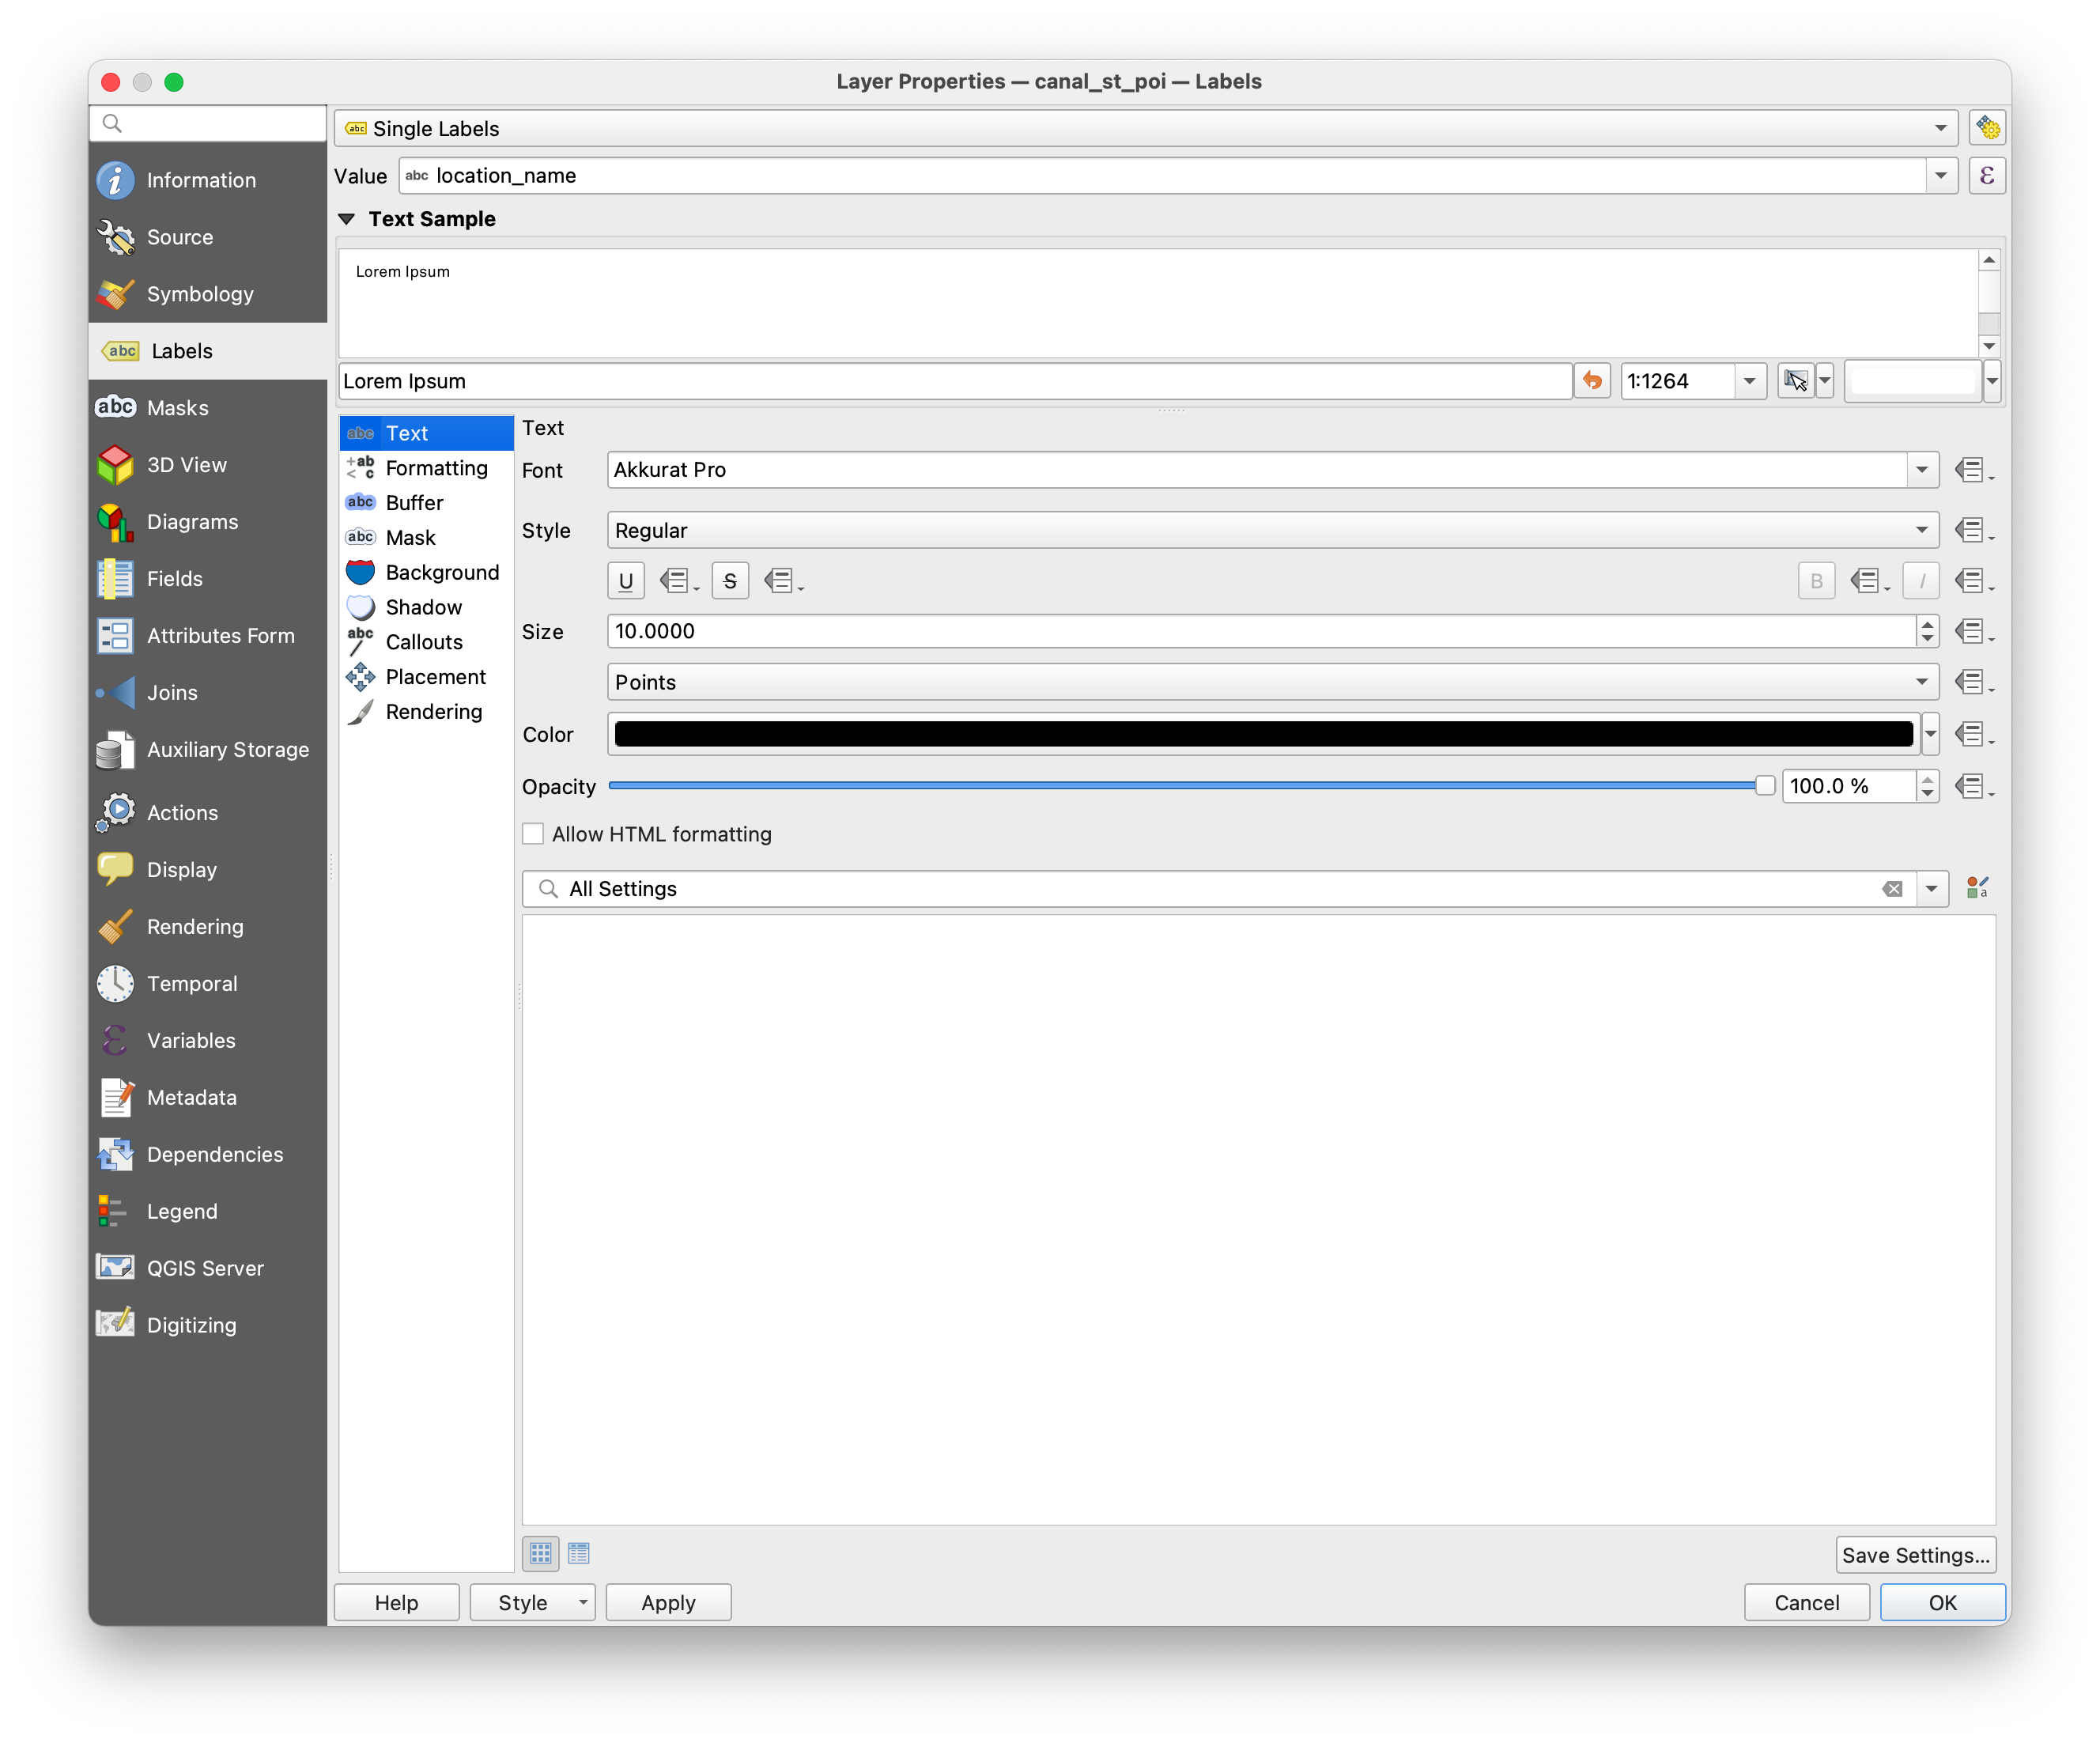
For large scale maps you might like to add labels for the names of businesses. Open the layer properties for the POI layer then click on the Labels tab. Make the following selections and/or format the labels as you would like.
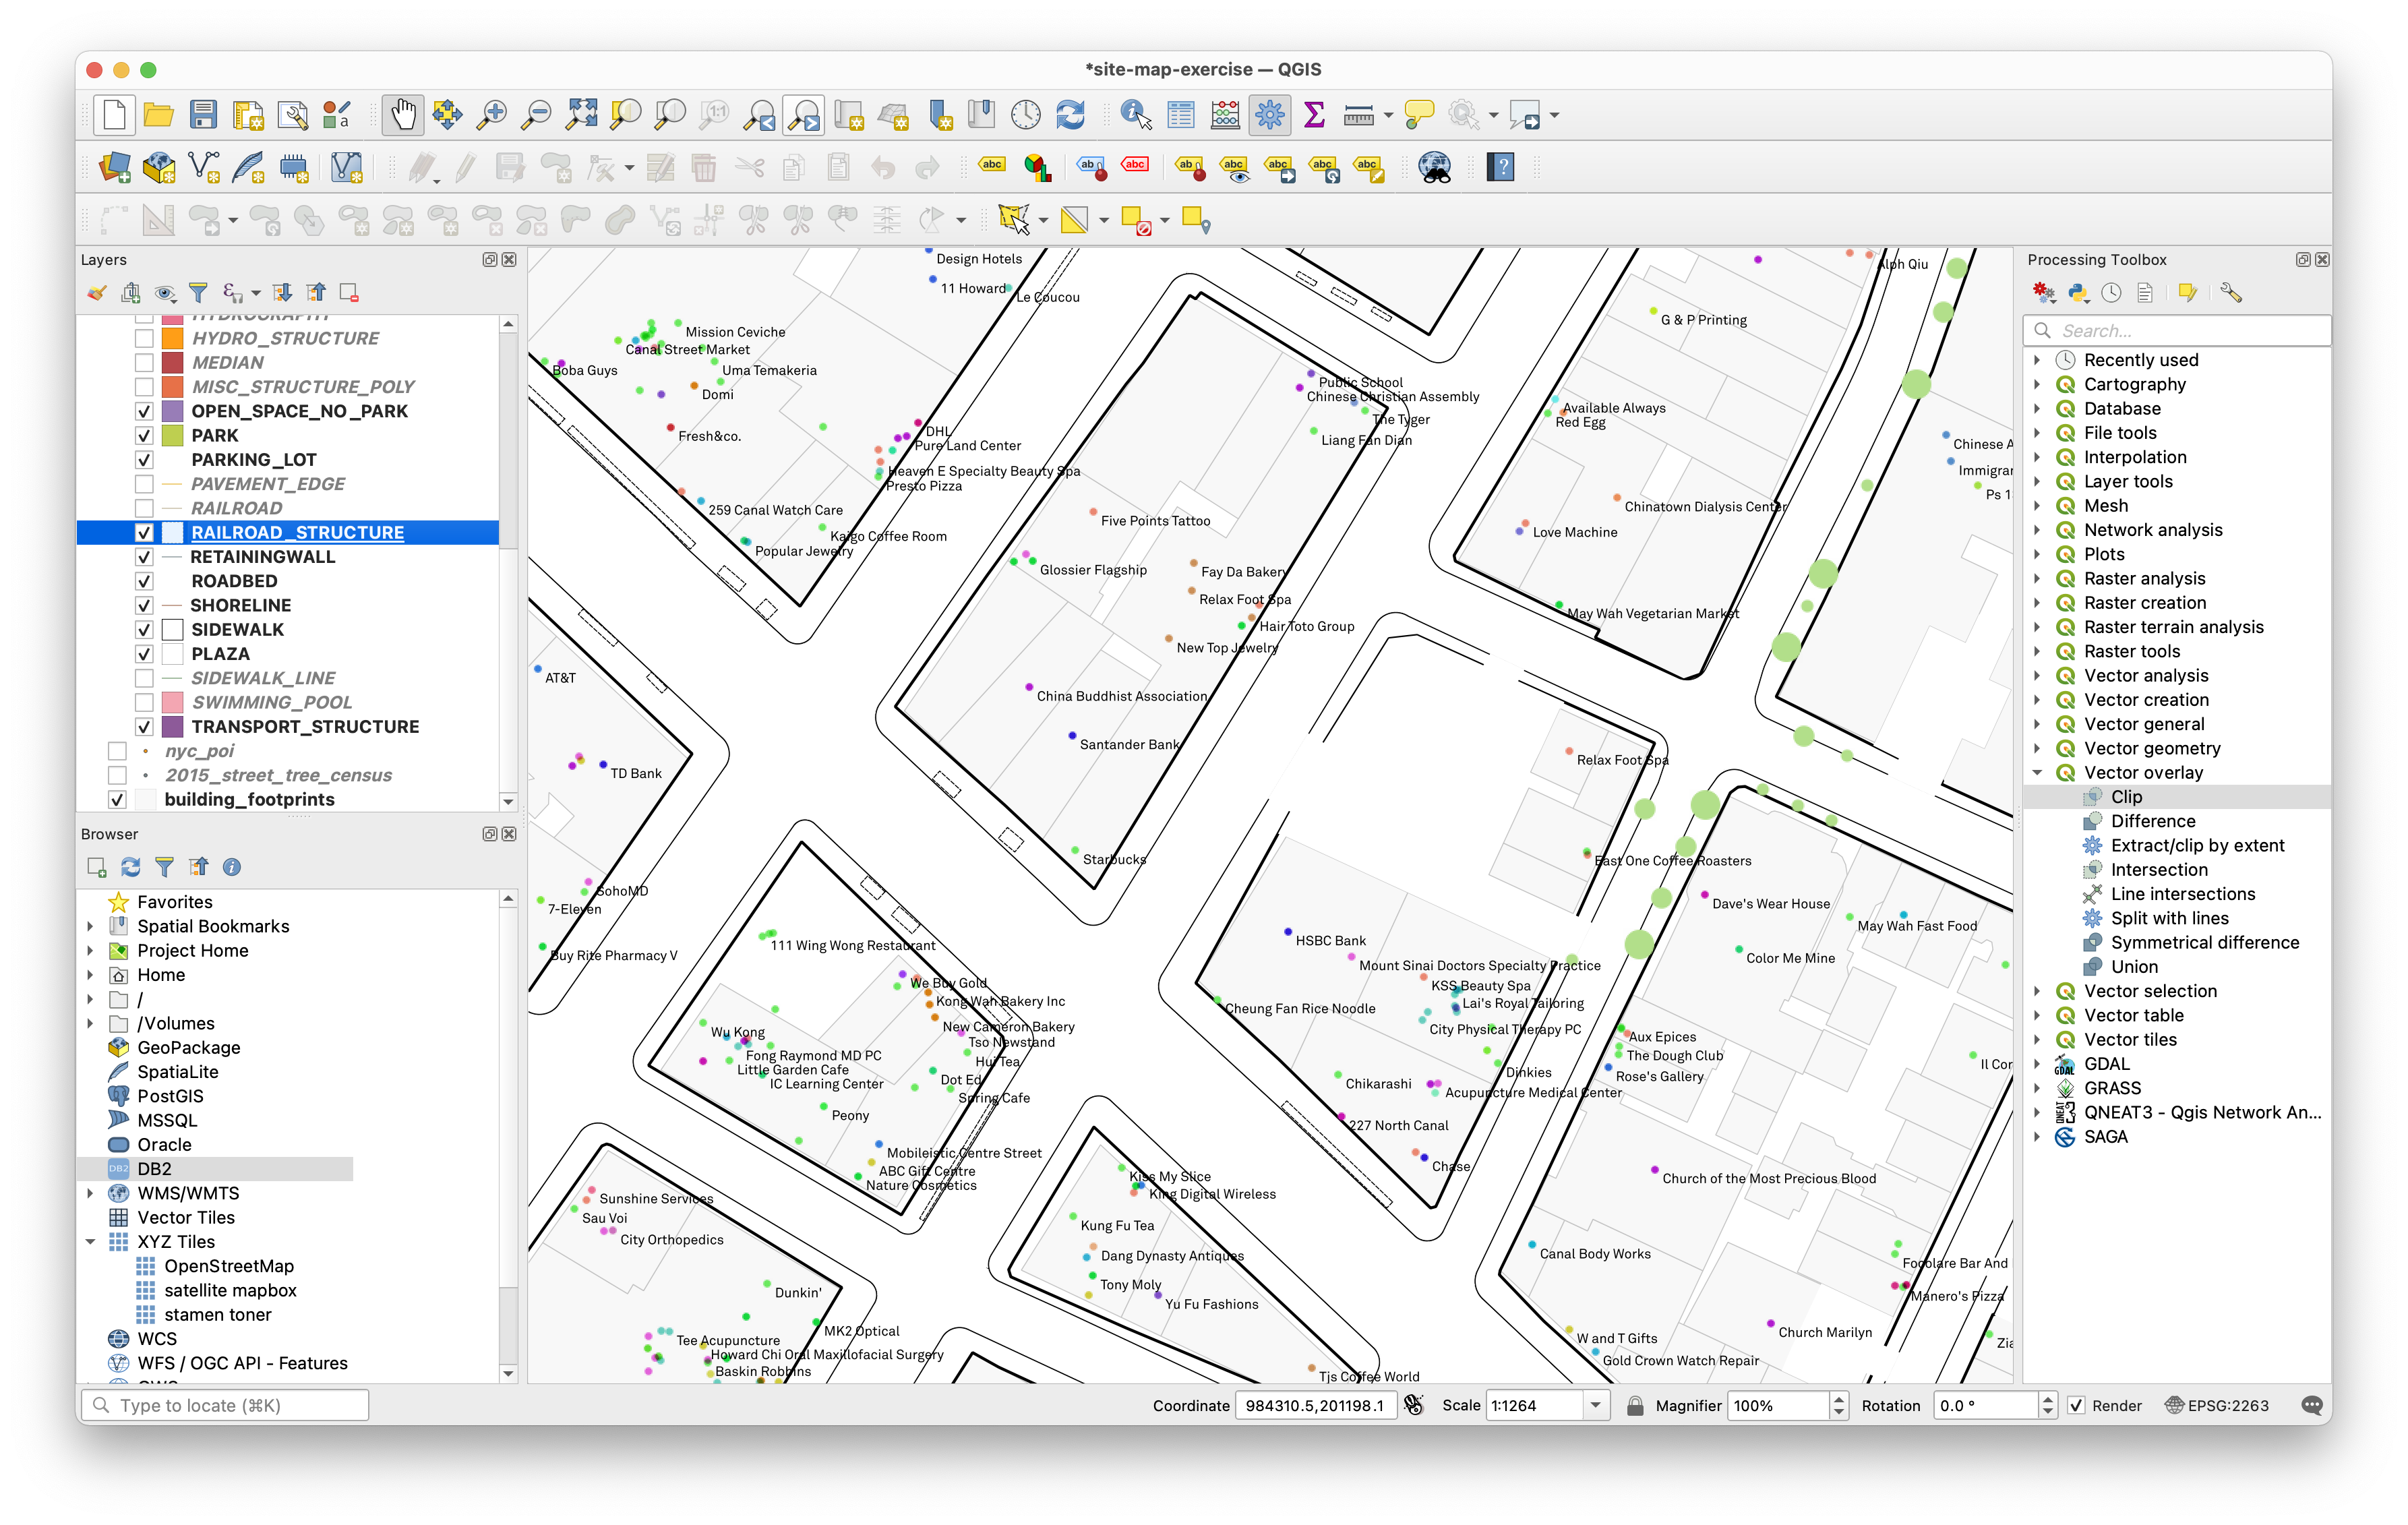
Experiment with changing the symbology for the layers within the NYC planimetric datasets, and the building footprints to produce a base map that you like. Experiment with changing the layer rendering mode for the points of interest and the street trees.
Uncovering patterns in businesses
Now lets refine this a bit further to present an argument about closed businesses. We will add a new layer of just those POIs that have been marked as closed and overlay this on top of our map to highlight the closed businesses.
Open the attribute table for the Canal street POI. Scroll until you see the ‘closed_on’ column (field). Notice that certain rows have a year and a month listed in this field. This is a date that the collectors of this data recorded for when the business closed.
We want to select all of the businesses that have a value in this field and export them as a new layer to be able to analyze just those closed businesses.
First we need to learn a bit more about how this data is stored – what type of data is being used by the column? Is it text? is it numeric?
Open the properties for this layer. Click on the Fields tab and look at the type name listed for the ‘closed_on’ field. It is a String (i.e. text).
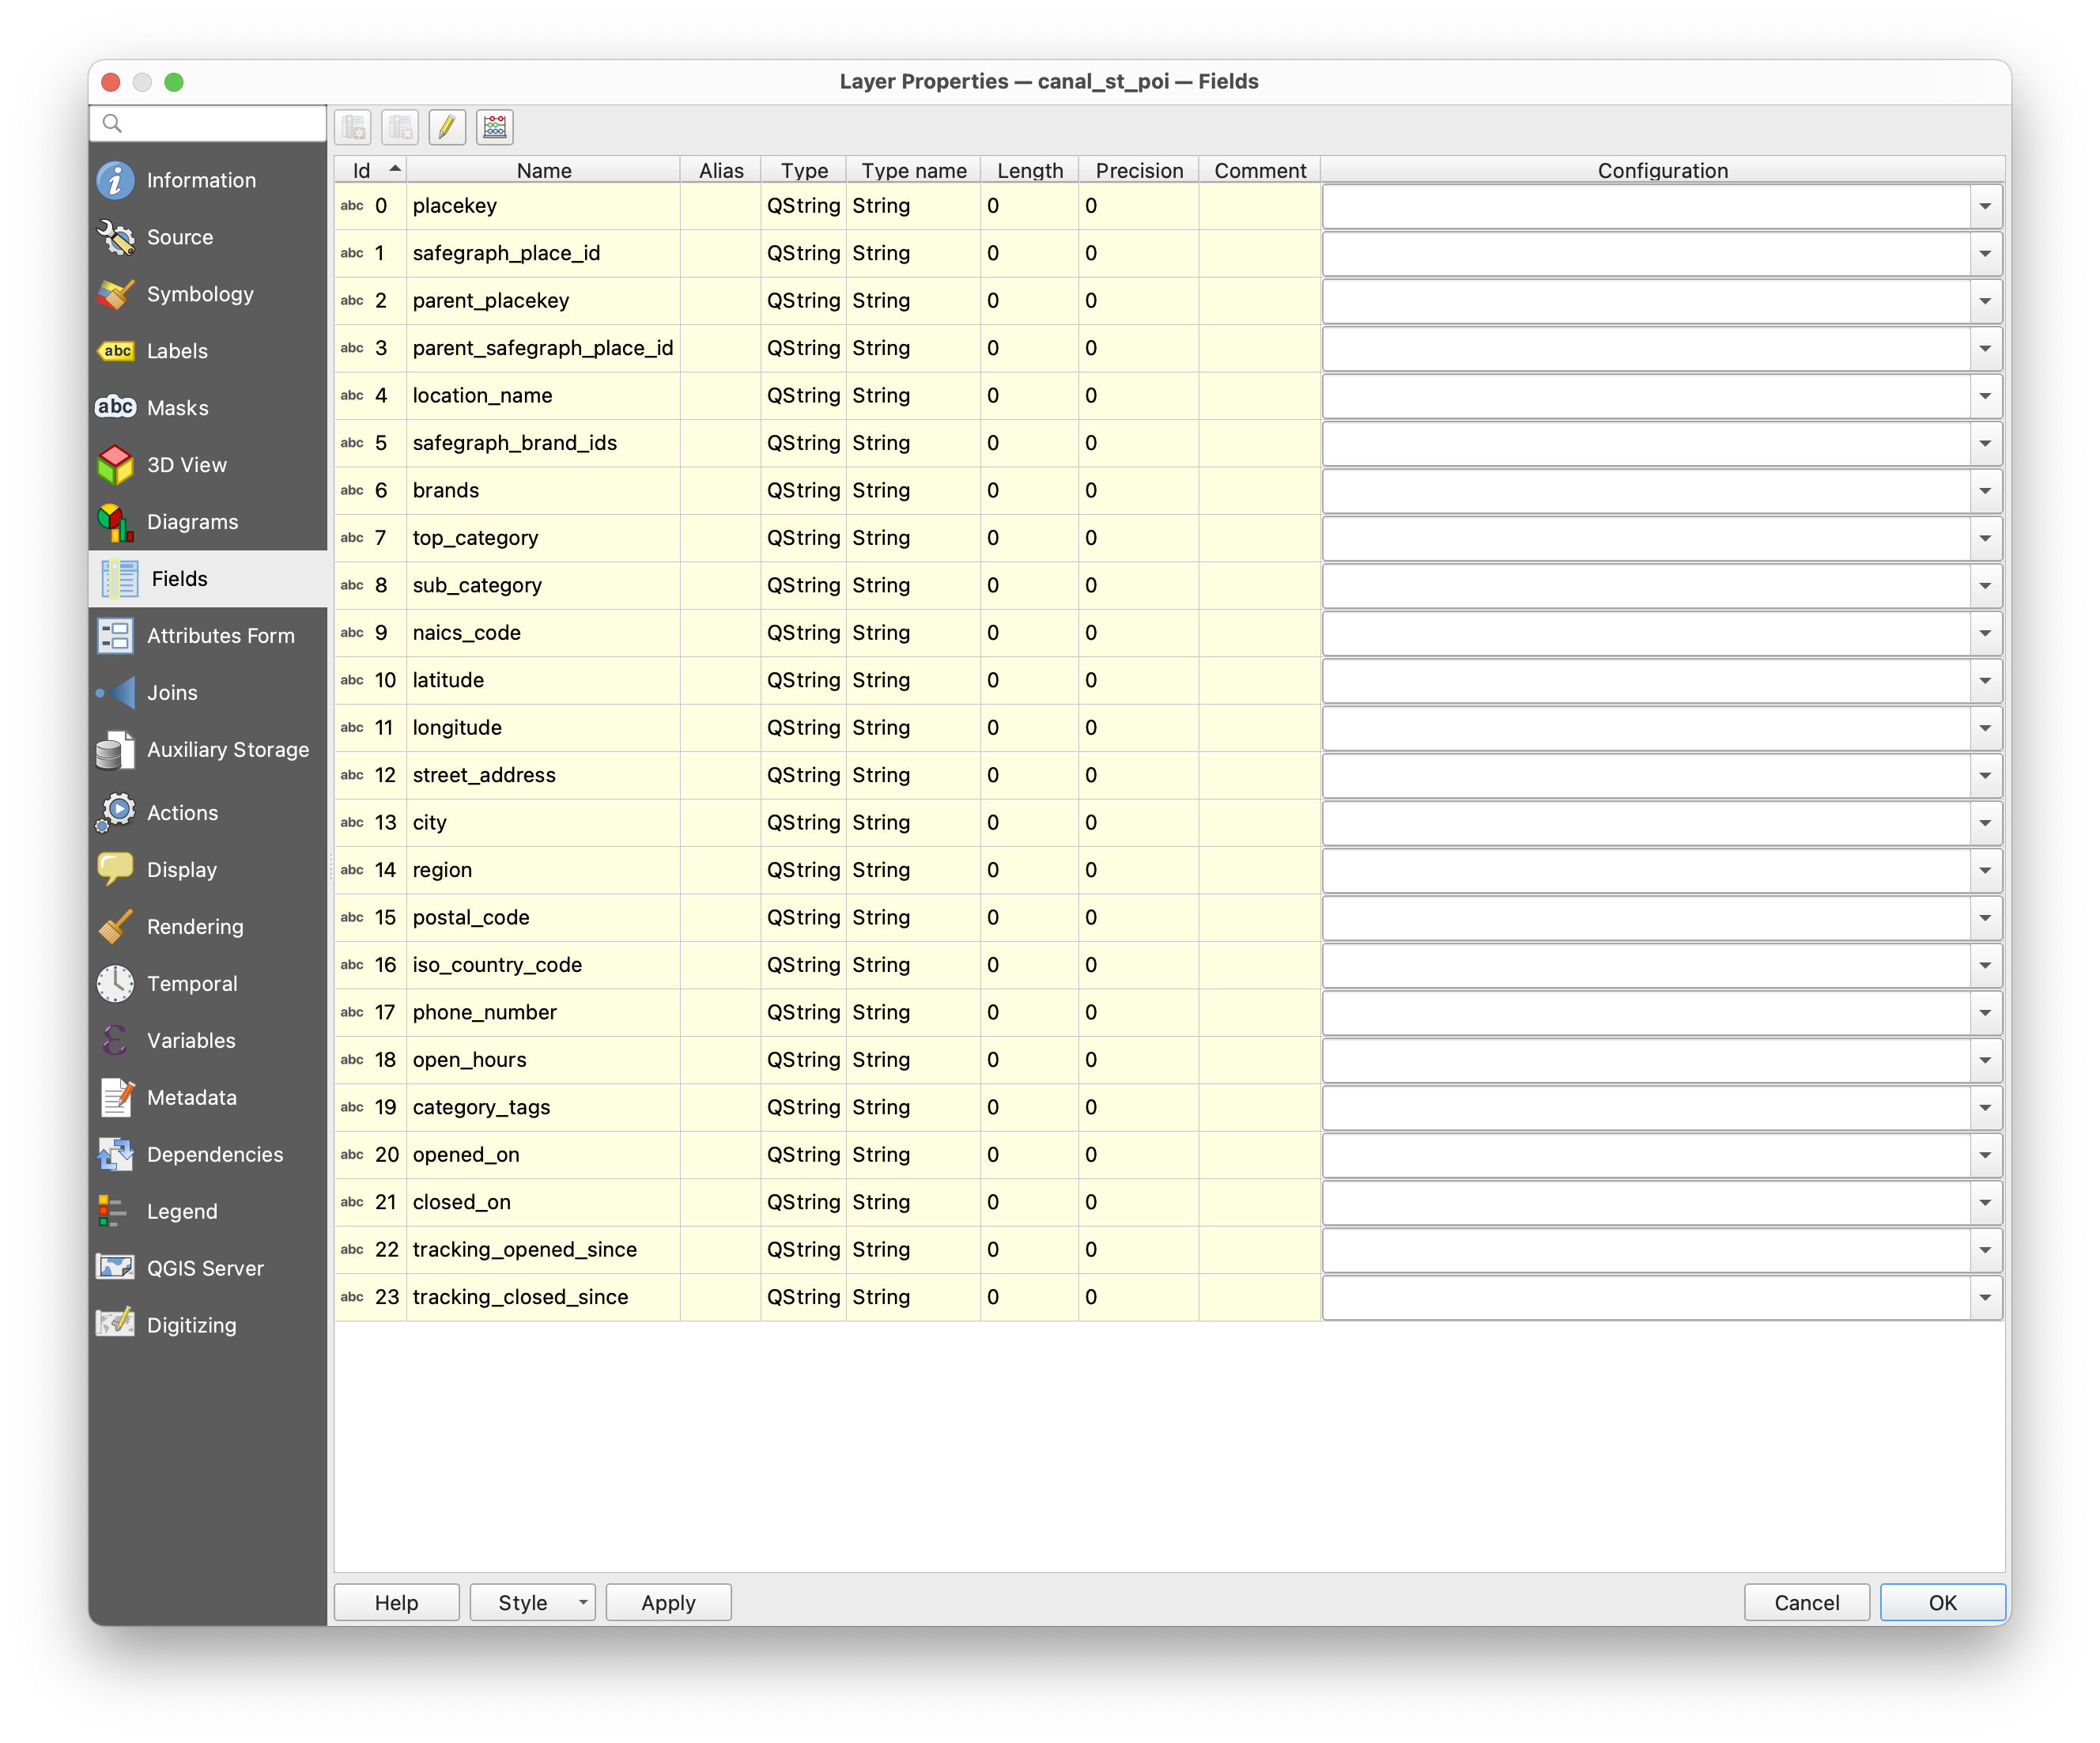
The way that the data is stored in this column dictates how we are able to query the column. Because it is stored as text (as a ‘string’ type) we need to use string operators to query the column.
Okay now we will use something called the Select by Expression tool to select all of the records that have a ‘closed_on’ date.
Open the attribute table for the canal street POI dataset.
Open the Select the Expression tool (circled above), and use the expandable lists to construct the following expression. First open the ‘String’ menu, then the ‘fields and values’ and then type >0. (You can also type the expression as it appears here just be sure not to add any additional characters, you are using a programming language called SQL to build this function).
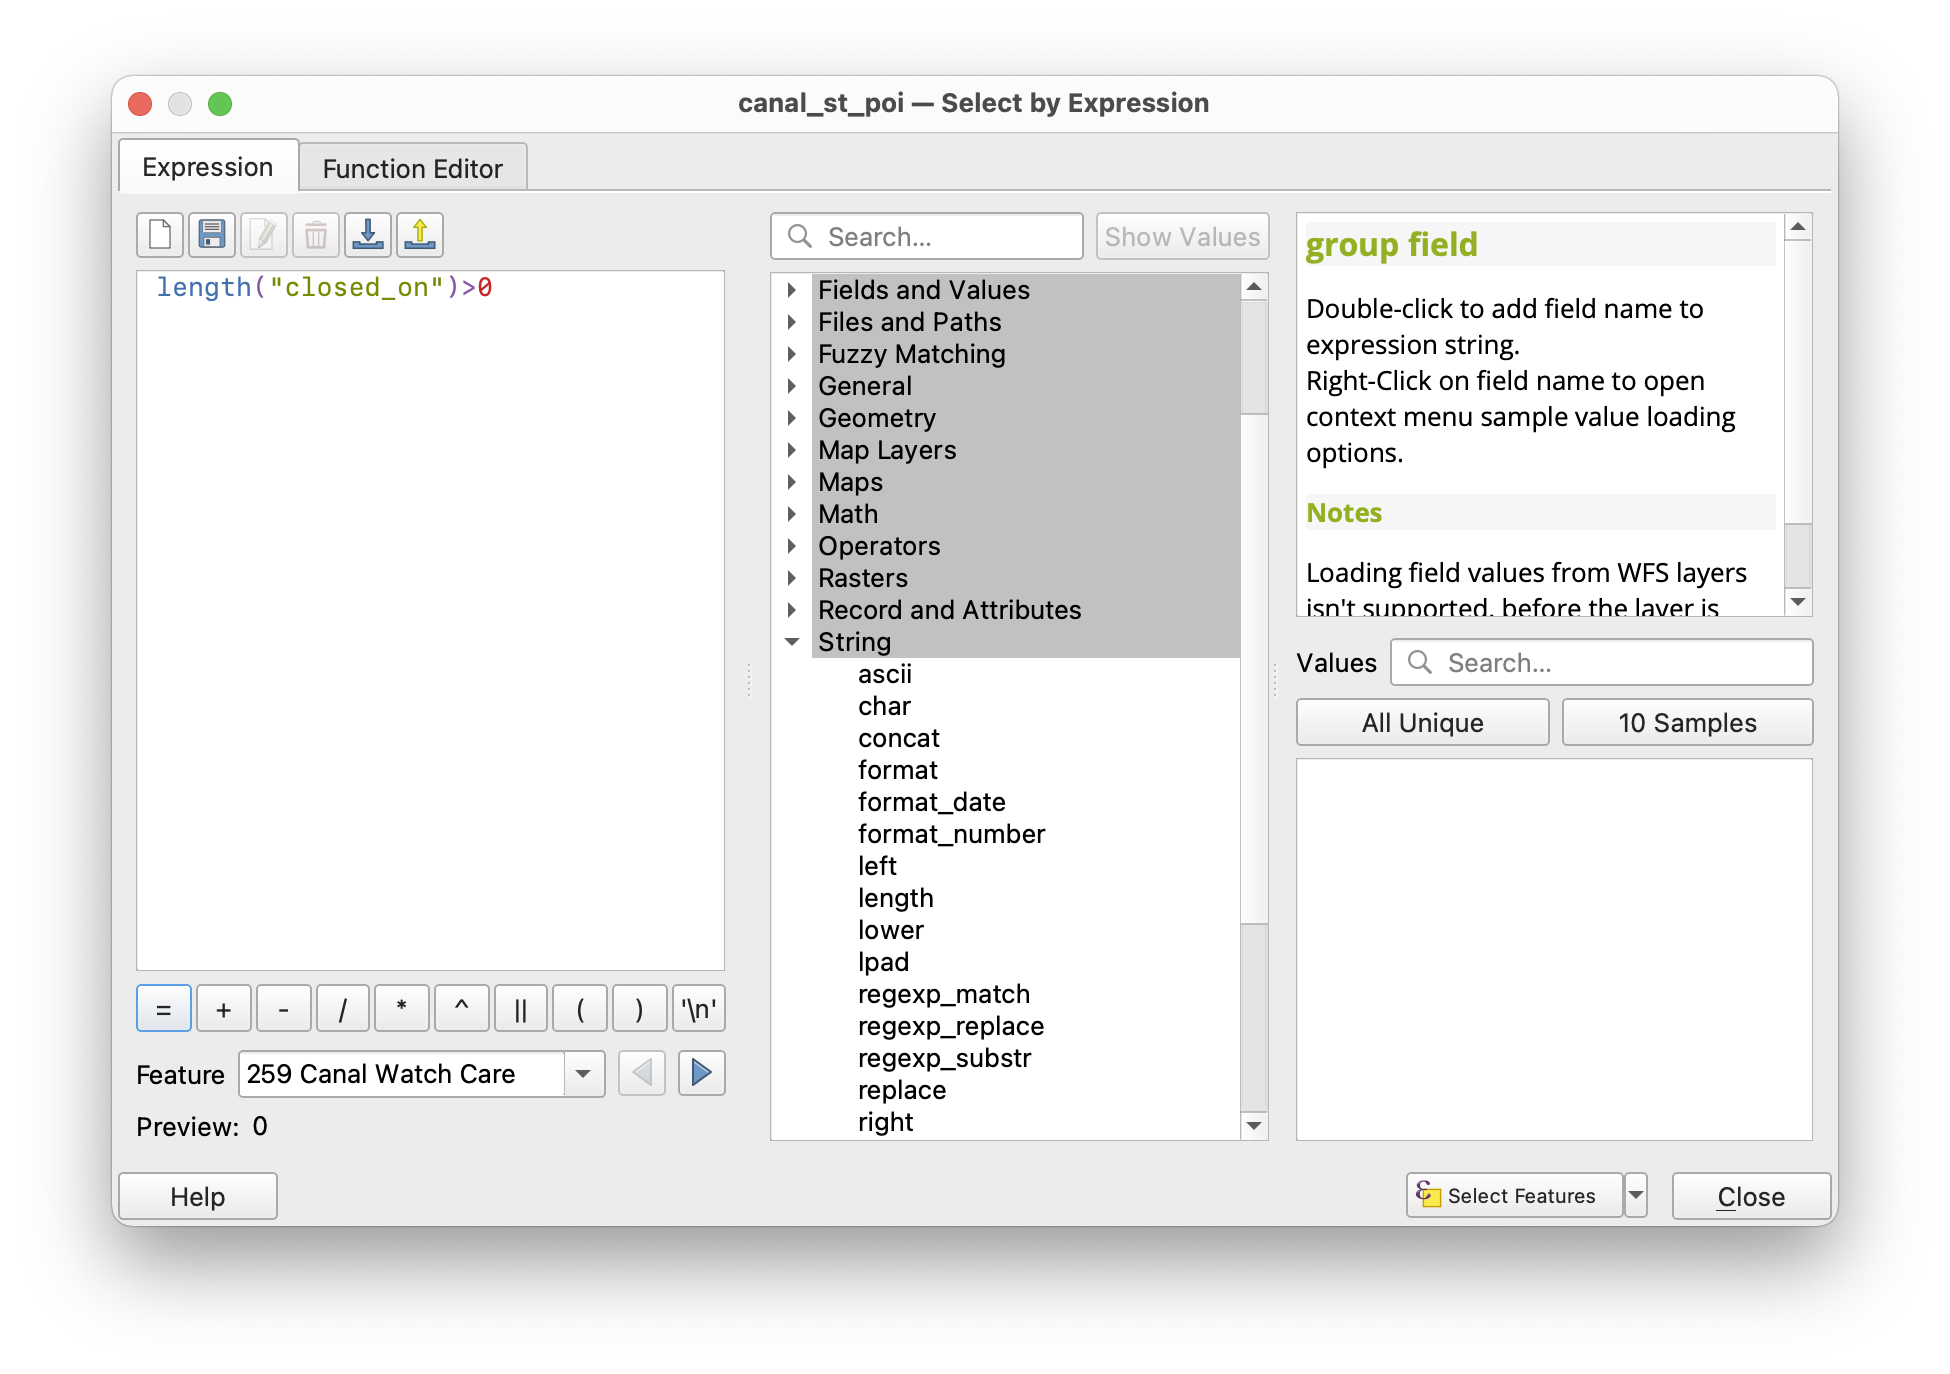
Once you have the selection expression, click Select Features. Close the Select by Expression window. If you look at the attribute table for the canal street POI dataset you should see that 201 of the 1406 businesses were selected. You can also see this in the bottom of the main QGIS map window.
Now we will save these selected features as a new dataset of closed businesses near Canal Street. Right click on the layer name in the layers panel. Select Export > Save Selected Features as and then make the following selections:
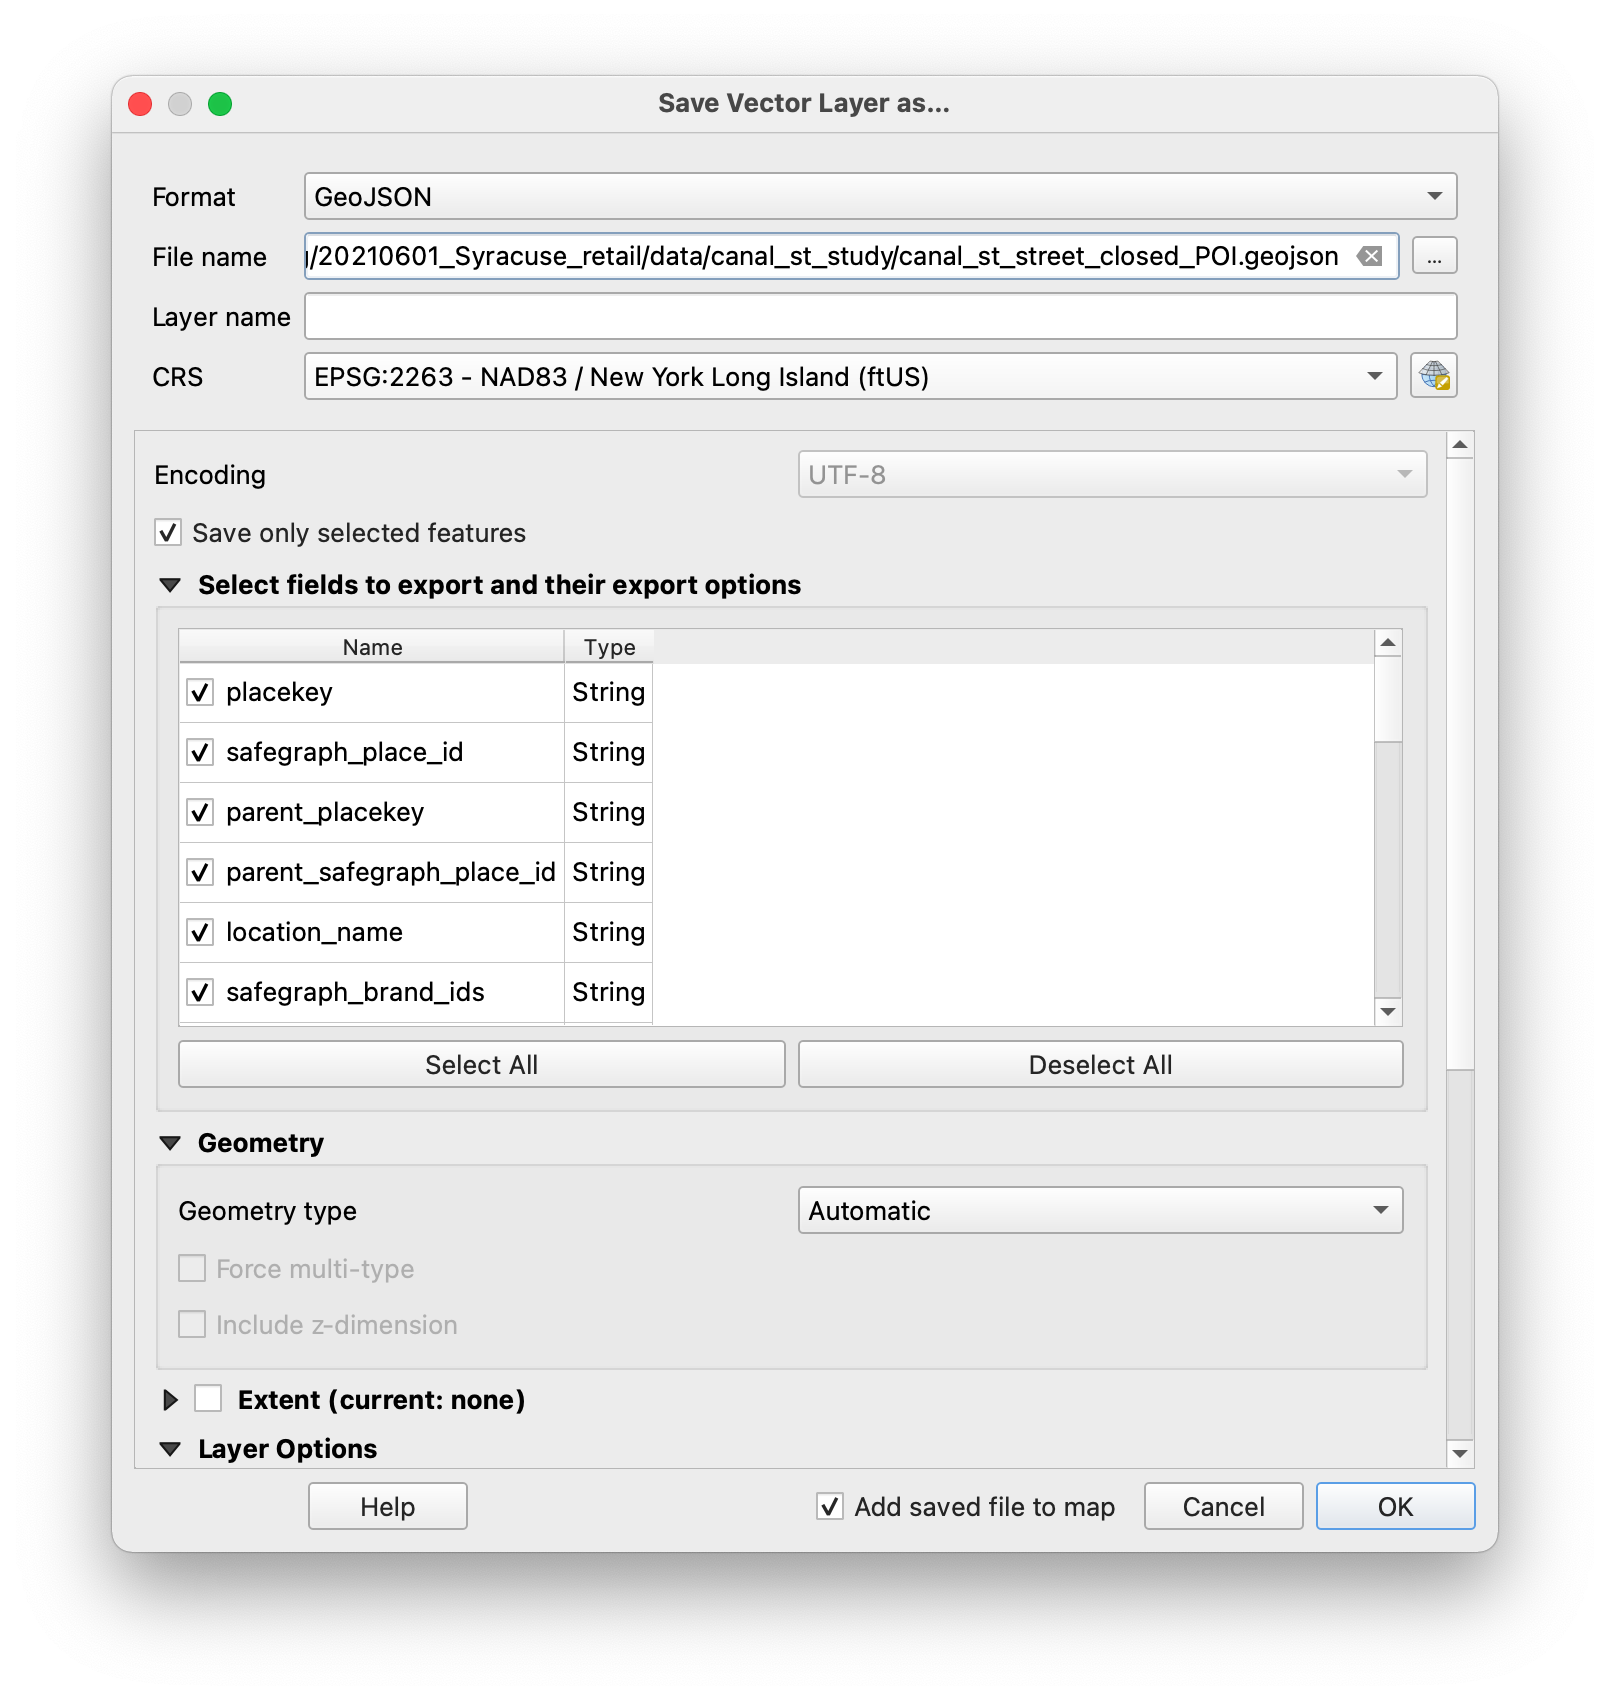
Change the symbology of this layer and experiment with labels to call out the closed businesses in this area.
Exporting
There are multiple methods for exporting your work from QGIS. The next section of the tutorial outlines three of those methods:
- Designing and composing a map layout fully within QGIS
- Exporting svg graphics to further edit with a graphics editing software
- Exporting dwg files to edit/work with in CAD software
Use one of them to export your work from QGIS and design a compelling site analysis drawing.
Compose a map layout with QGIS
When you are satisfied with your symbology choices and are ready to export a map document from QGIS, you will need to create a New Print Layout. You can use the “New Print Layout” button on the Project Toolbar (to the right of “Save As”) or the Menu Bar via Project > New Print Layout. Enter a title for your layout and click OK.
In QGIS, the Print Layout functionality is contained within a separate window from the main interface. Like the main window, you’ll notice a Menu Bar, Status Bar, some Toolbars and Panels (on the right instead of the left). The biggest difference is that the Map View has been replaced by the Layout View, which is where you’ll compose your different layout elements to create your finished map.
Here you can also use Tooltips to learn more about elements of the interface. Or visit the QGIS docs here for an extensive description of this area of the program.
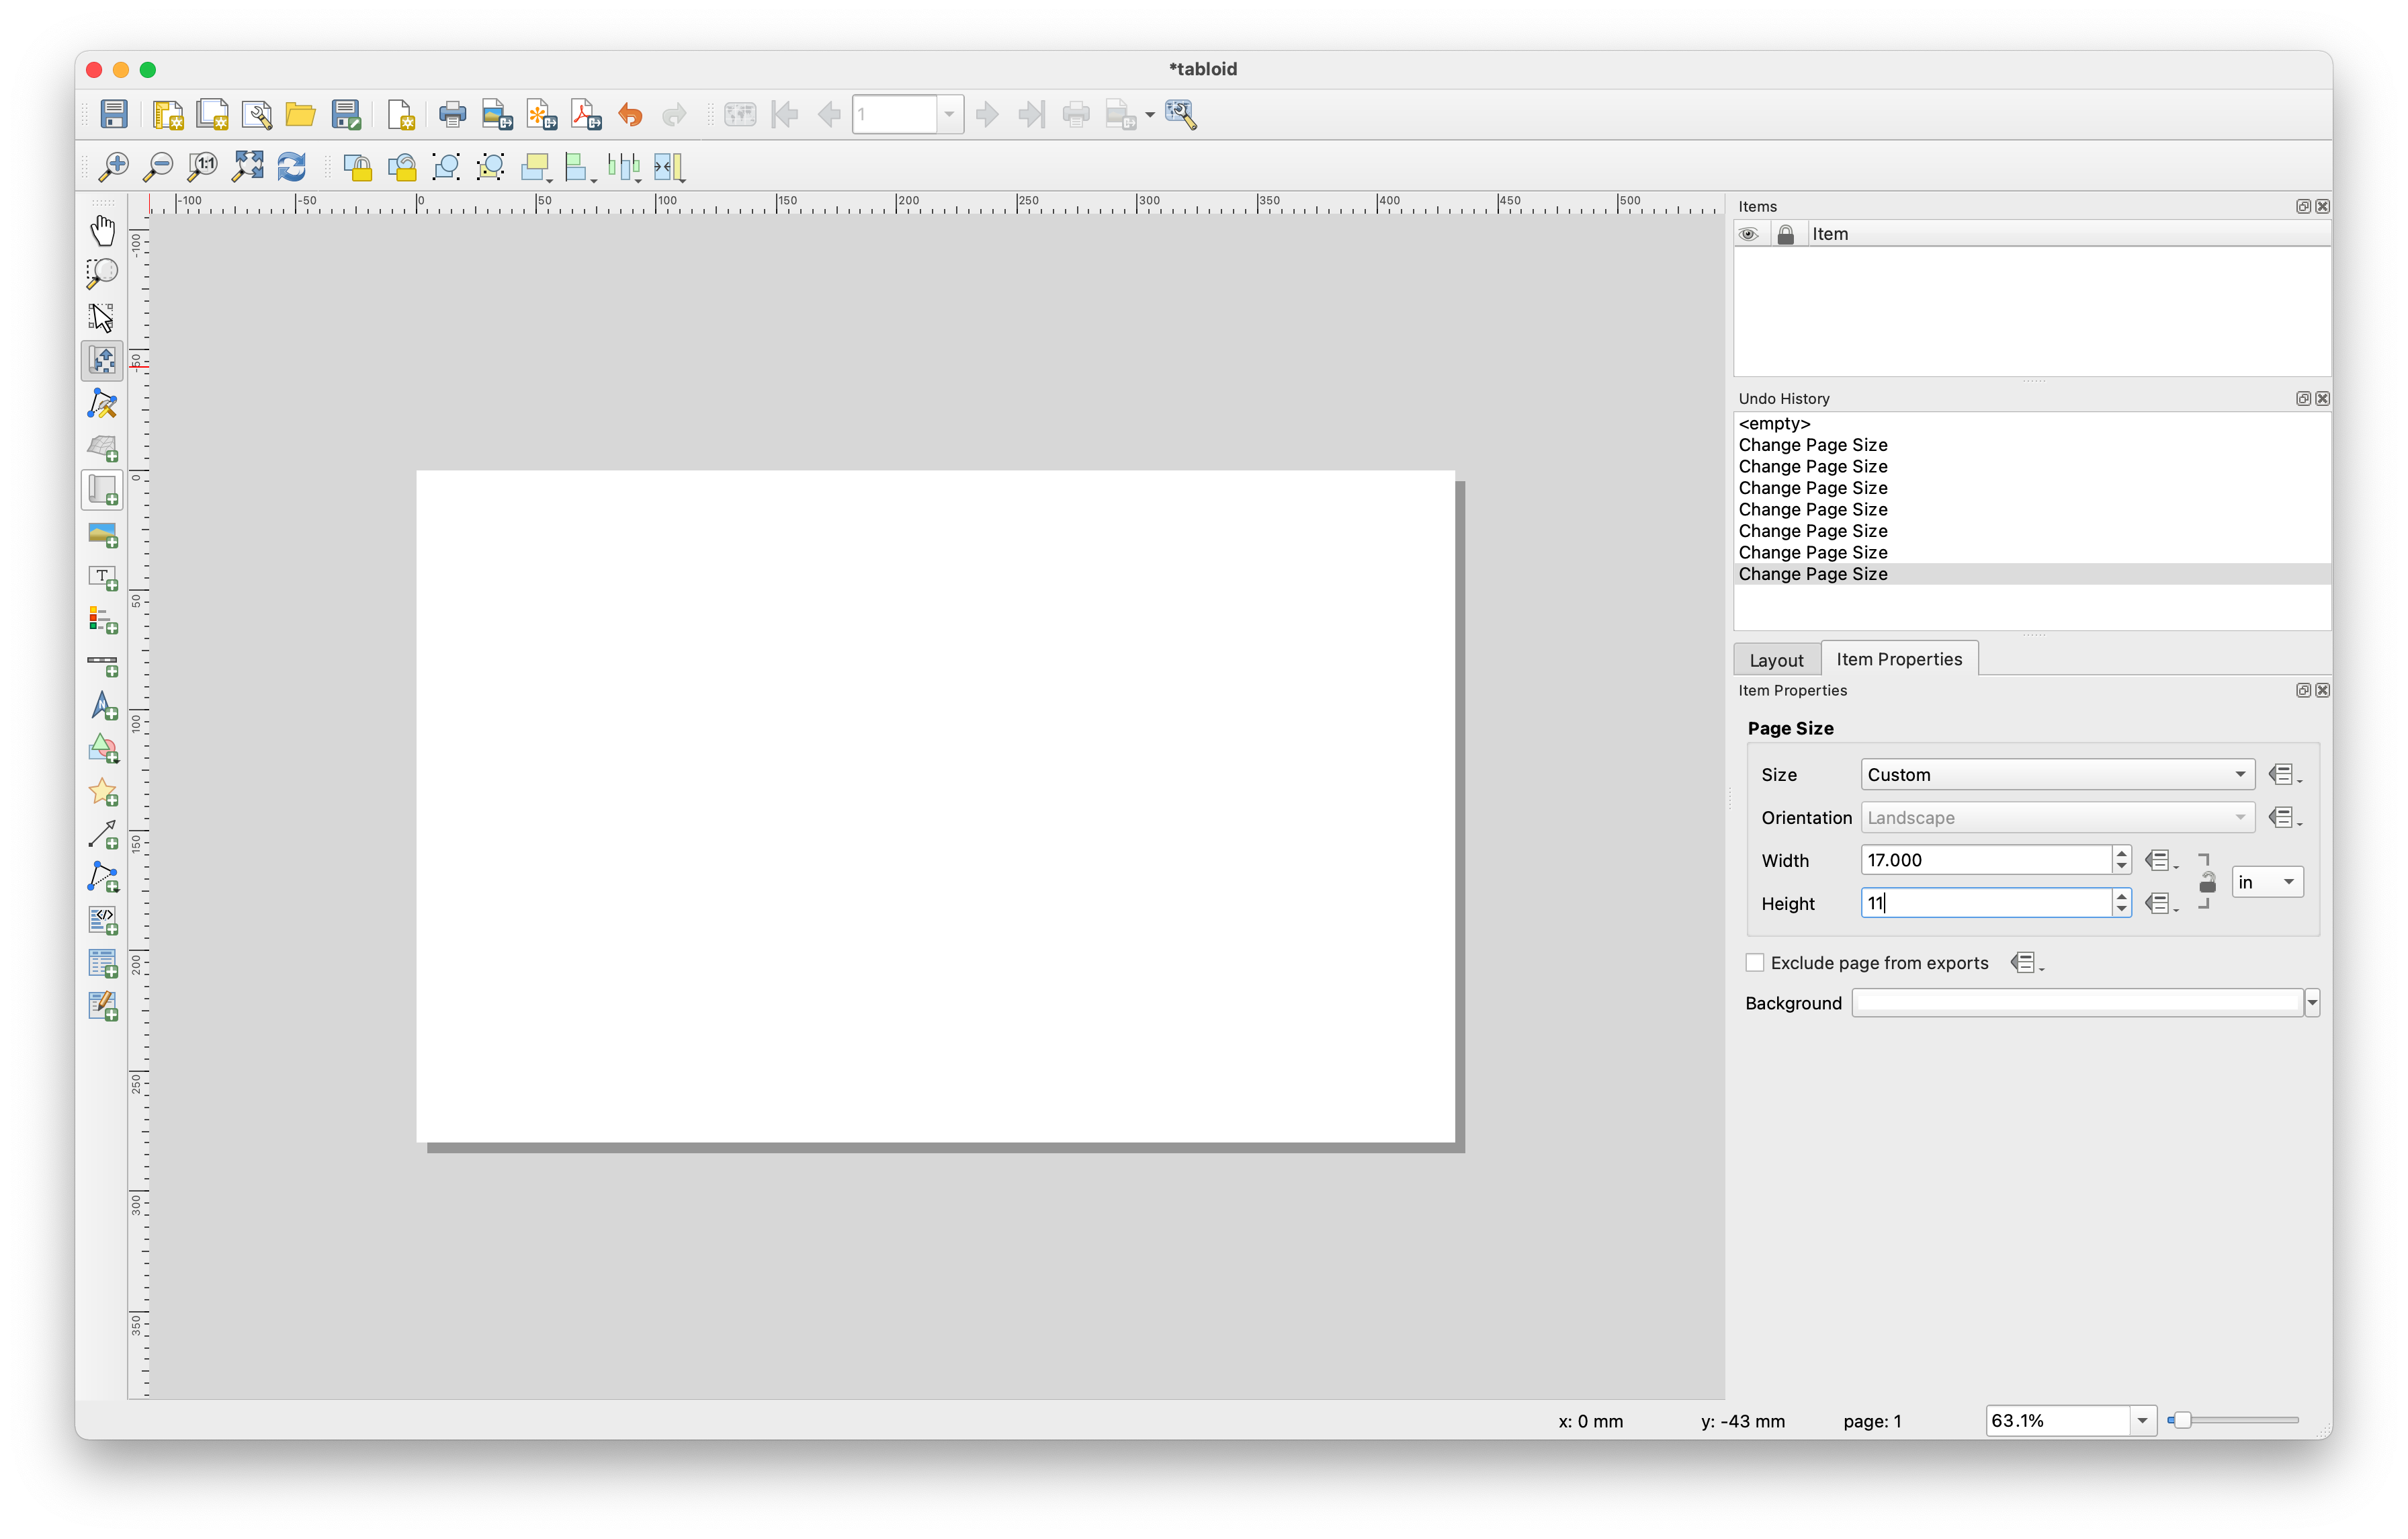
If you would like to change the page/paper size right click anywhere on the blank canvas to open the page properties. Page Size options should appear in the Item Properties menu at the right hand side, and you can then set a new page size and/or orientation.
Use the “Add Map” button or Add Item > Add Map on the Menu Bar to add a map view to your layout. With the tool selected, click and drag over the part of the layout where you want the map to appear. Notice that the appearance of the map, including layer visibility and symbology options, have the same appearance as in the Map View in the main window.
Try using the Pan Layout tool and the Zoom tools on the toolbar. You’ll notice that in the Print Layout, these control the view of the layout itself, rather than the map view you’ve just created. To manipulate the contents of the map view, you’ll need to use the “Move Item Content” tool or the Item Properties panel tab when the view is selected. Try using the panel to change the scale and rotation of your map view.
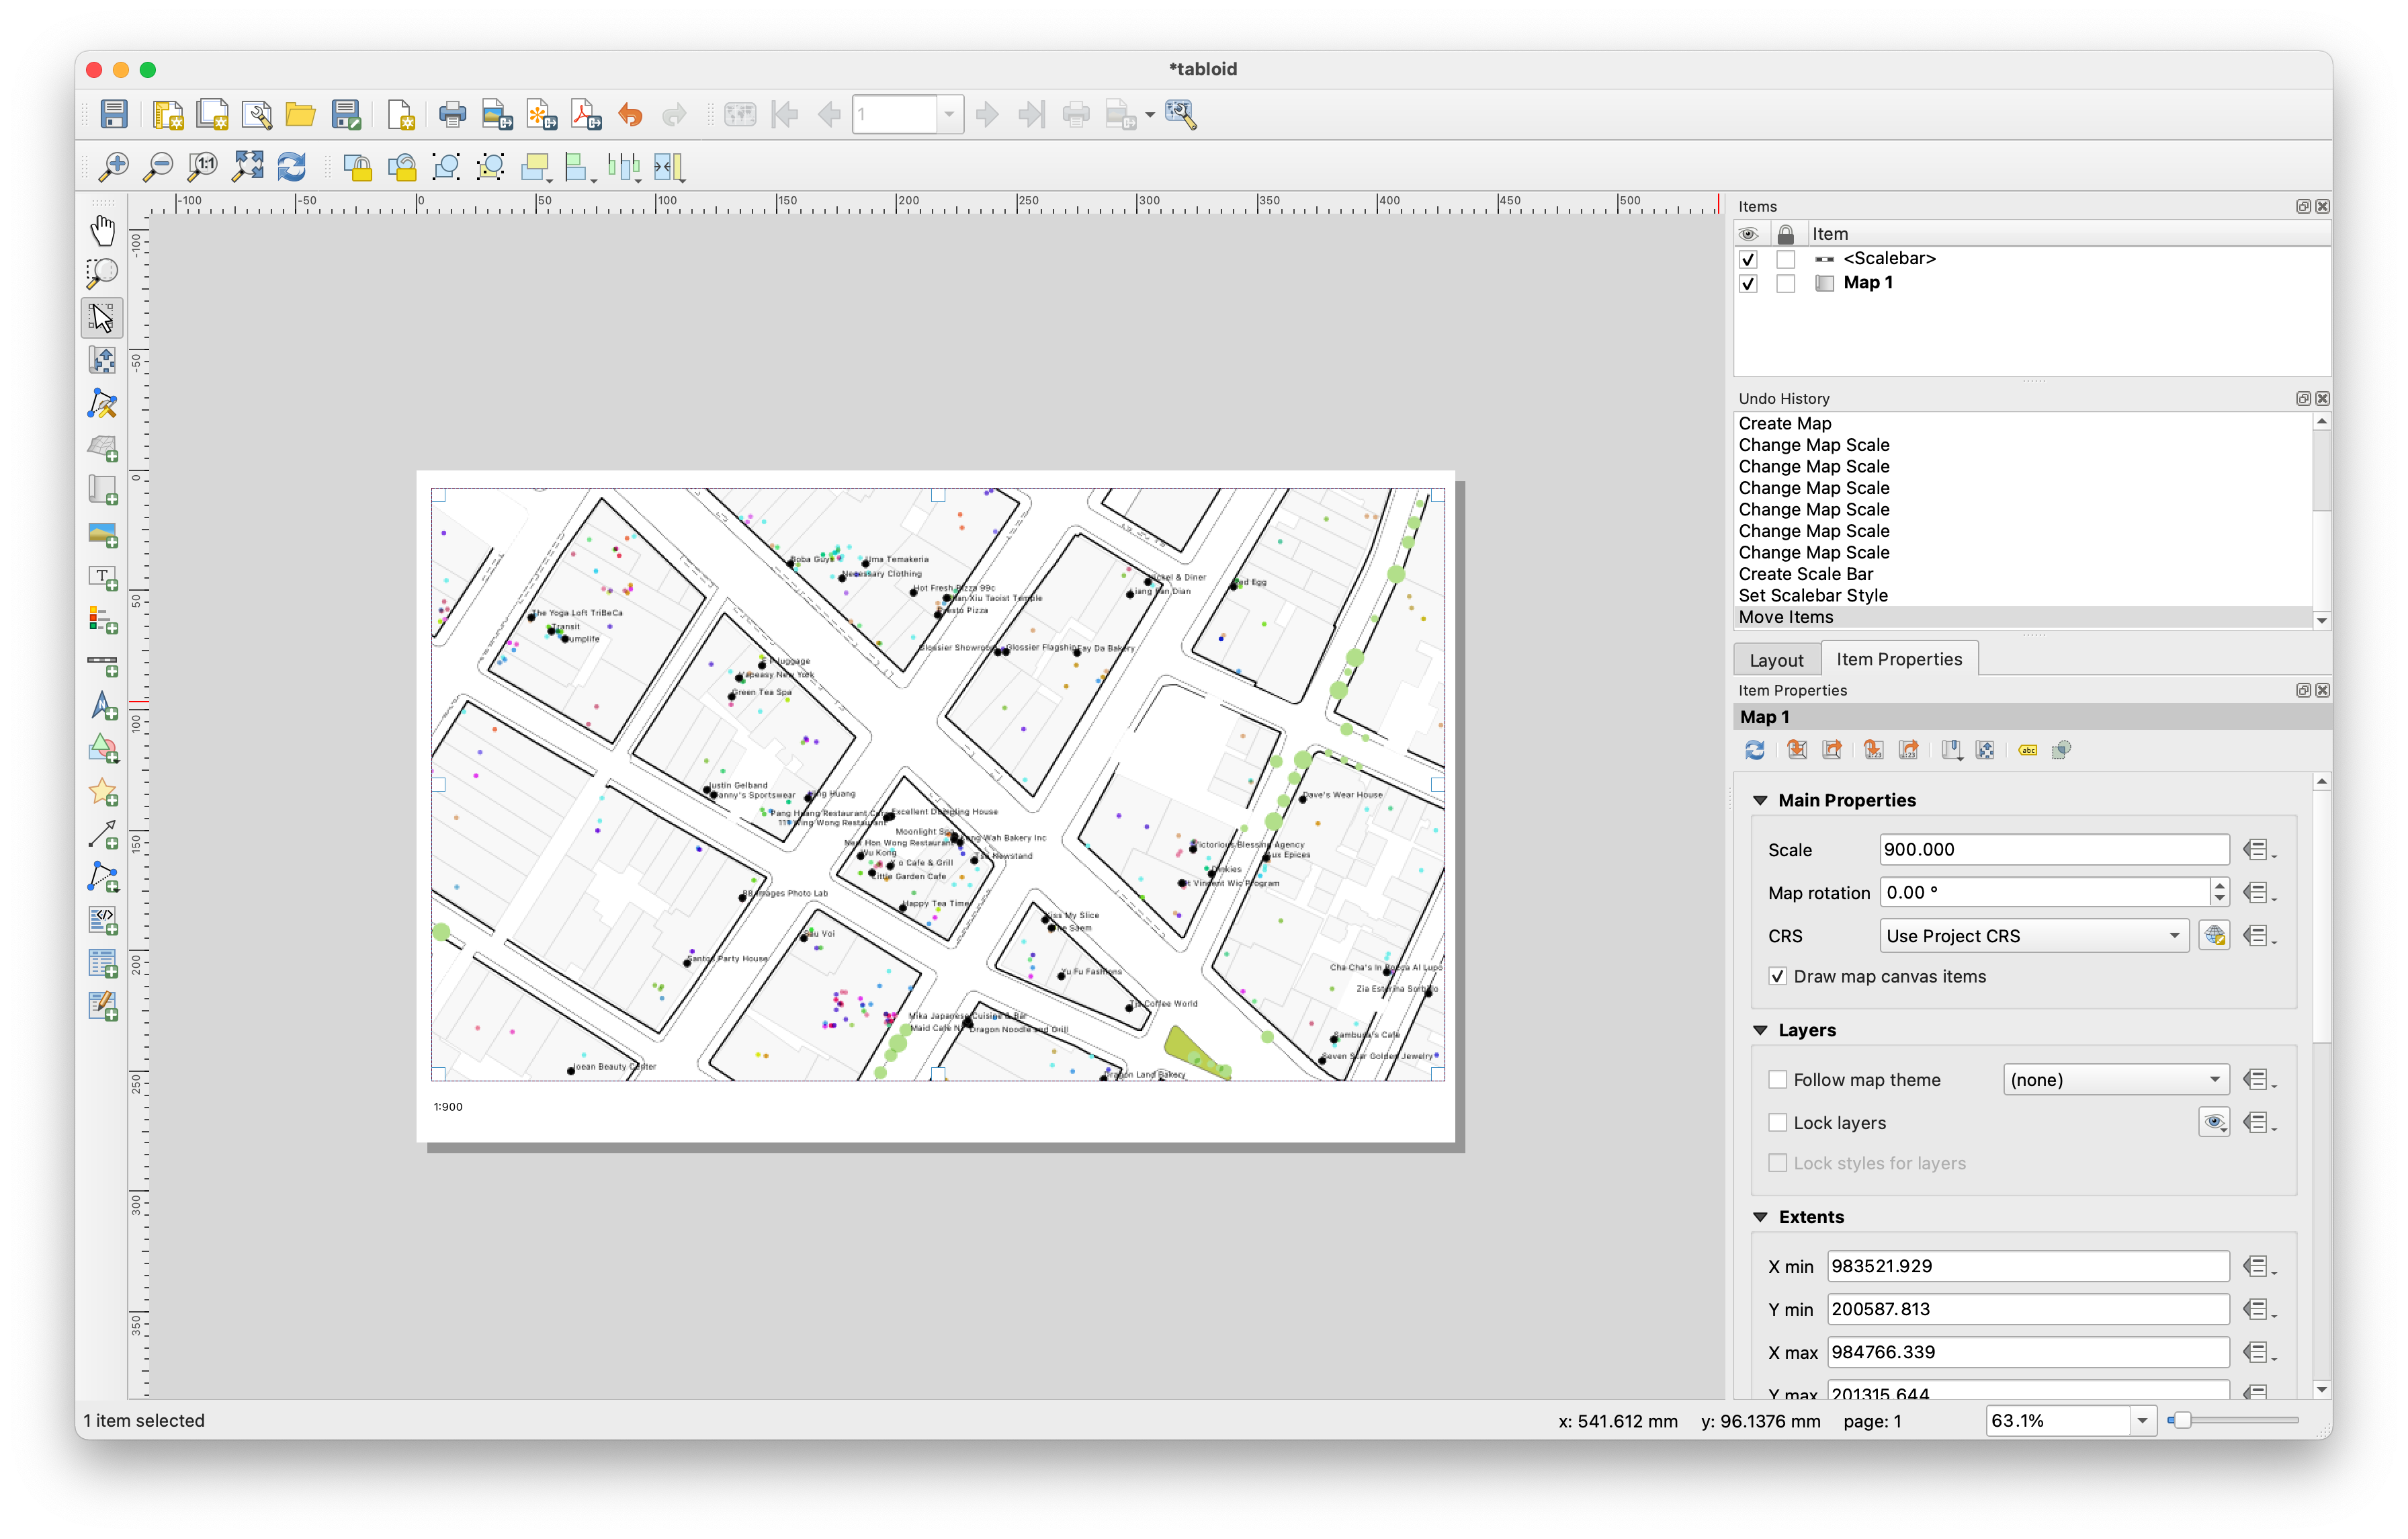
Next use the Add Scale Bar button, circled above, to add a scale to your map. This can be numeric (as shown above) or a graphic scale bar. Adjust using the Style menu for the scale element.
Next, use the Add Legend button (or menu item) to create a Legend. Again, click and drag on the layout to set the item’s placement. Notice the layout guides that automatically appear to help align the new item with existing elements on the page.
When you are happy with your design use the export tools in the top tool bar to export as an PDF, image file, or to print directly from QGIS.
Export svg graphics to further edit with a graphics editing software
To export SVG graphics that you can continue to edit further in a different graphics editing environment follow the steps above to create a new print layout, set a paper size, and add a map window and any legend or scale bar items you would like to work with.
Then use the export SVG button to export in SVG format. You can open this in Illustrator or your vector graphics editing software of choice.
Export dwg files to edit/work with in CAD software
To export datasets from QGIS to continue to work with them in CAD software you can export individual layers in a DXF format.
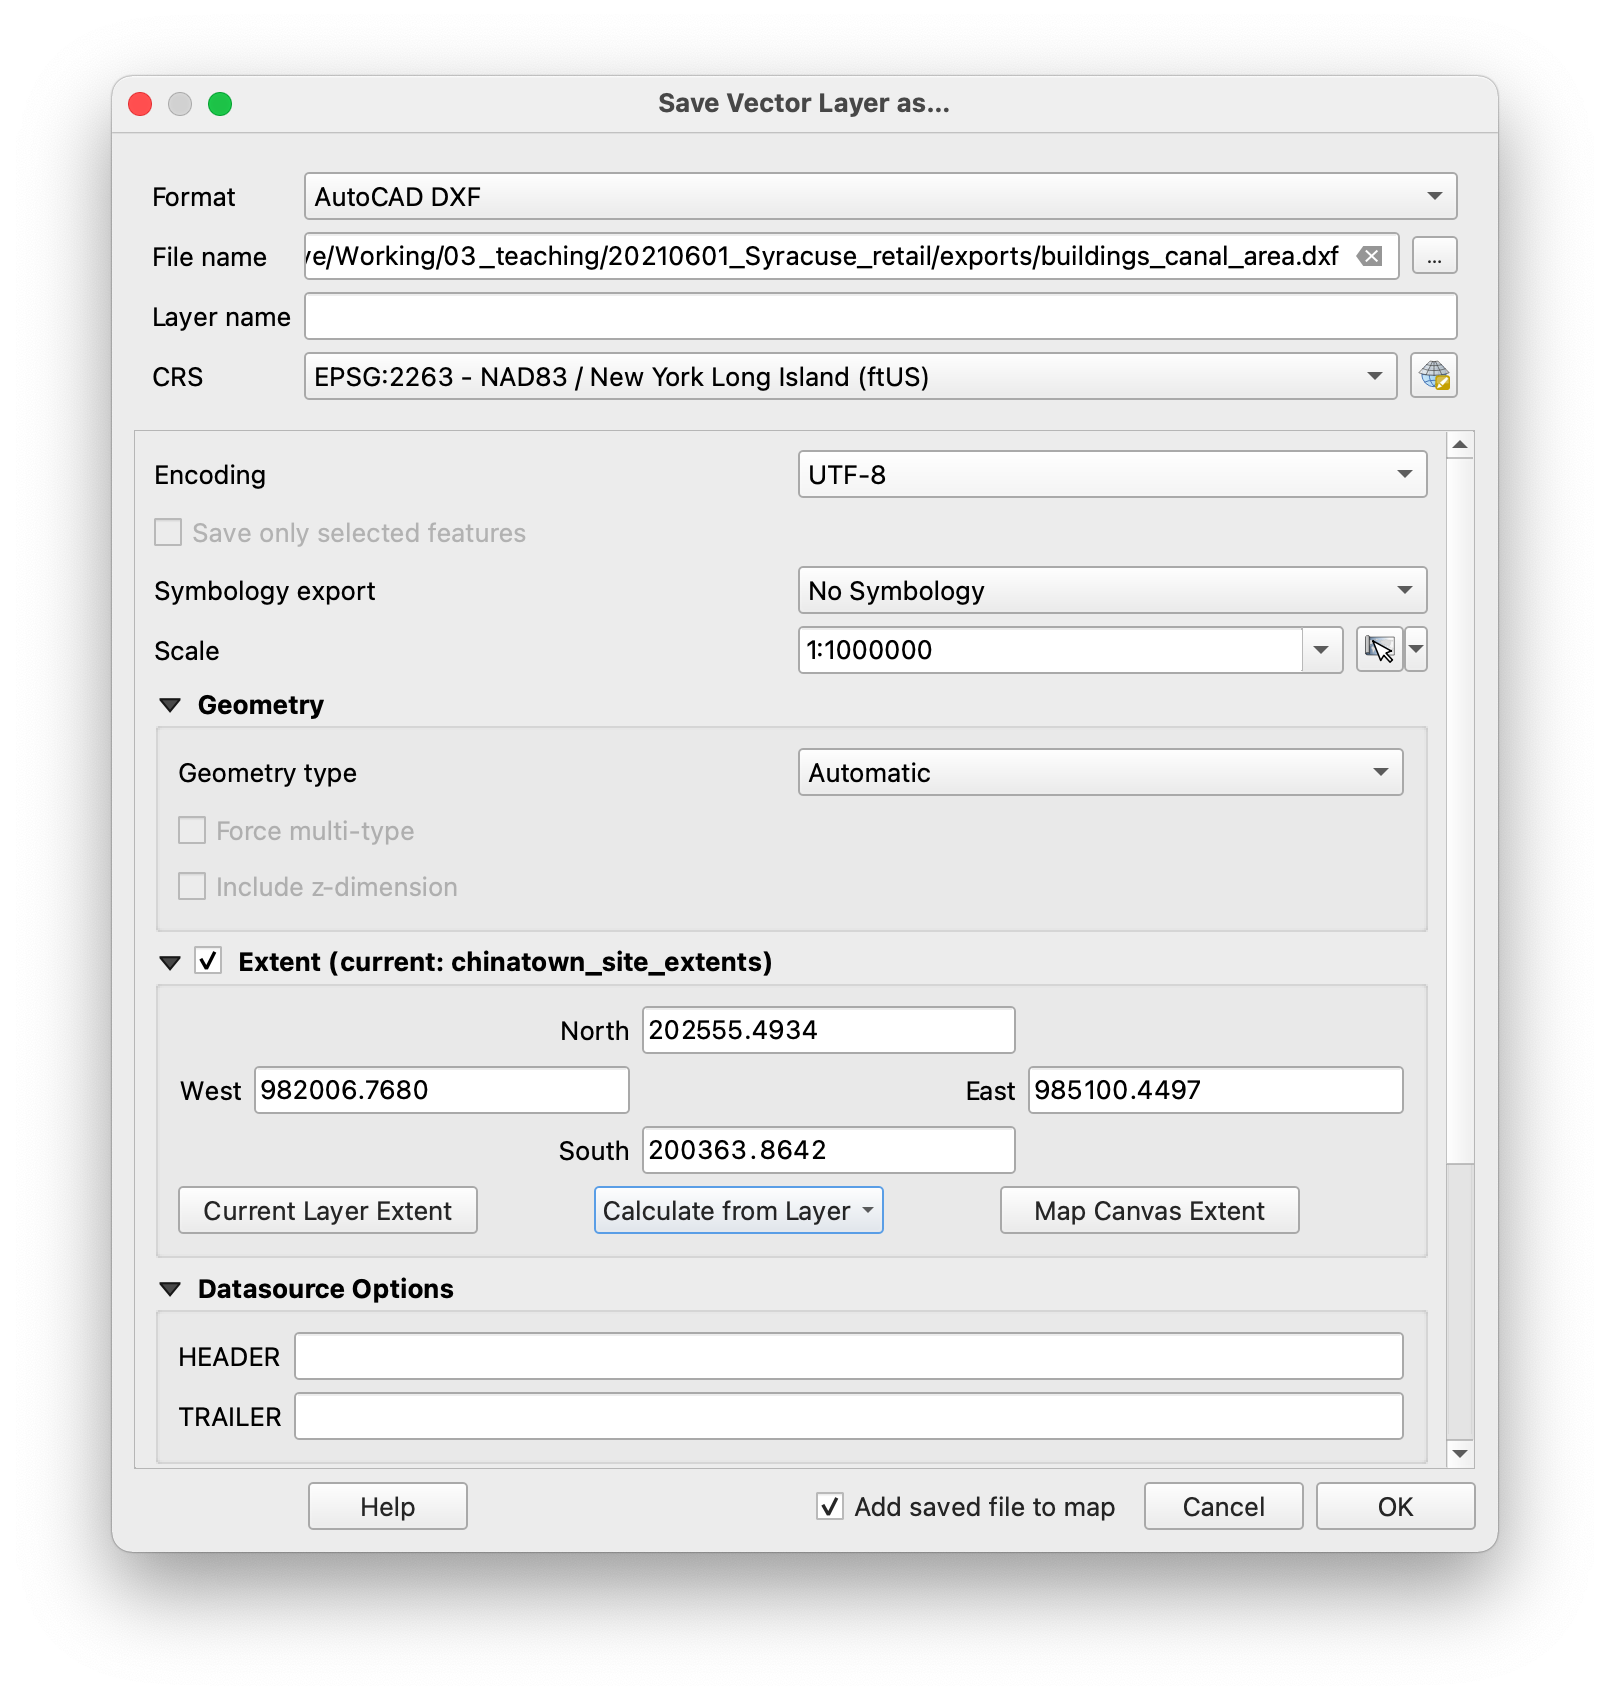
To do this right click on the layer name int he layers panel. Select Export >Save Features As. In the export menu that opens, specify AutoCAD DXF as the Format use the ... button to designate where the file should be saved. Then expand the Extent section of the menu to designate the spatial extents that you would like the layer to have.
The NYC planimetric data covers all of NYC. If you are working on a drawing of just a small area it is better to limit the extent of your exported file to a smaller area so that it is less unwieldy to work with in a CAD program. You can specify extents by giving coordinates in the coordinate reference system of your map project. You can set extents from the current map canvas, and you can calculate extents from a layer within your project.
If you plan to use multiple datasets it is important to select the same extents. Thus it is a good idea to use the extents of specified layer rather than just the map canvas.
Because we already created a layer to define our study area you can select Calculate from Layer and then select the canal street area extents layer you created earlier on in this tutorial.
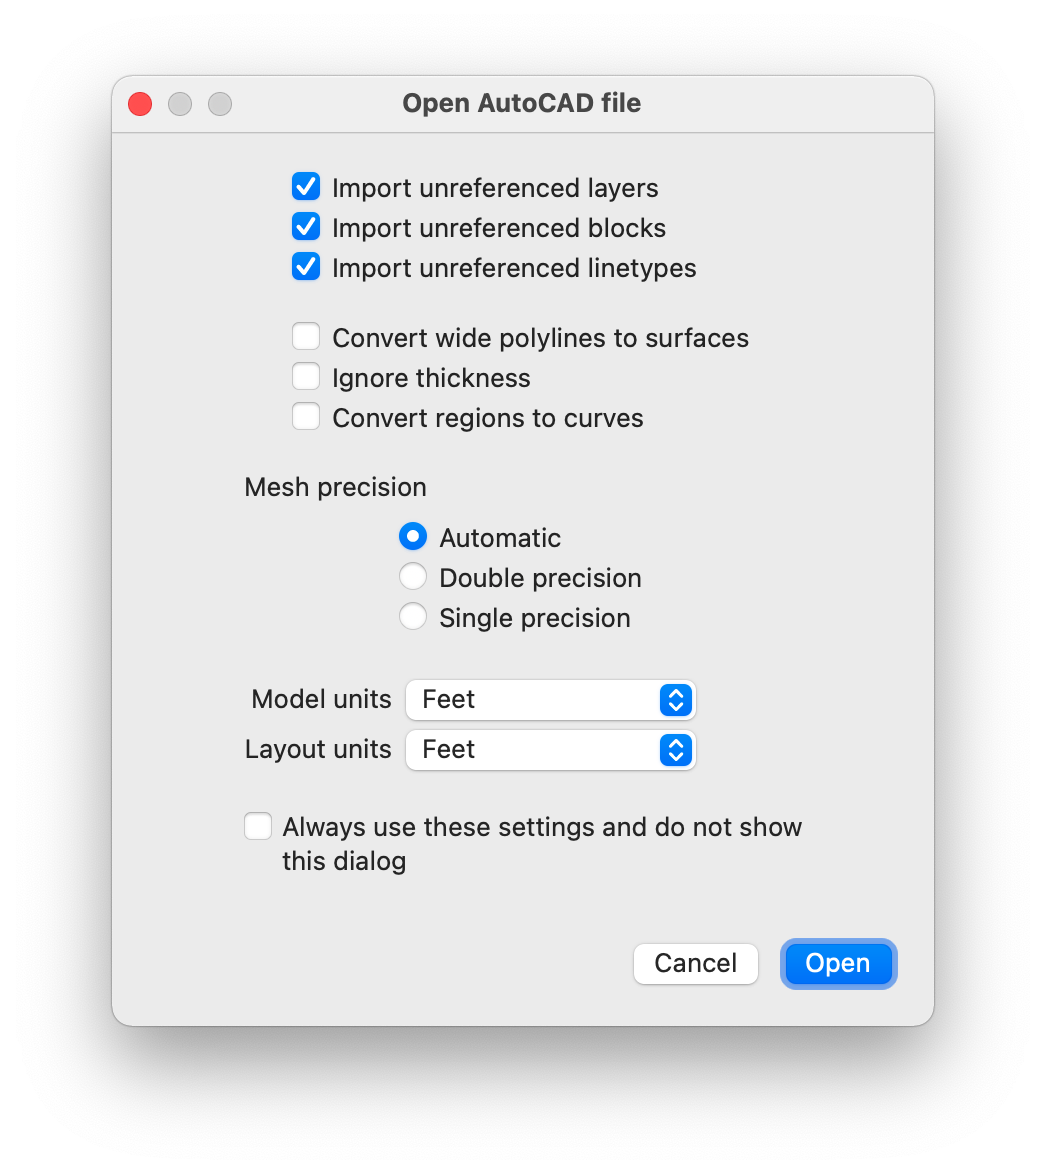
Once you export you can open the dxf file in Rhino or another CAD software. If you are opening with Rhino make the following selections on import (most important thing here is to be sure to select the same units as are used by the coordinate reference system from your data. In this case the New York State Plane System uses Feet):
If you are importing polygons from QGIS these will be rendered by Rhino as a hatch. If you want to convert to outlines select all features, then use the Explode command and then on the resulting surfaces use the Silhouette command.