In this exercise you will learn a few powerful tools for asking spatial questions using QGIS and open data.
Maps and geographic analysis are key tools for interpreting the built and social characteristics of cities– highly relevant for understanding commercial spaces today. Thoughtful uses of spatial data expose invisible patterns, and can change the way we see and engage with our world. However, maps are never just representations, they are always active in shaping the worlds they describe. With this in mind, the workshop will introduce approaches to gathering, visualizing, and interpreting spatial data as a starting point in the design process.
It buildings on the topics covered in Workshop 1.
Requirements
To complete this tutorial, follow the instructions below to gain experience asking and answering spatial questions related to retail in NYC.
Once you have completed the four questions below, brainstorm and write a spatial question related to your studio project research thus far. Use the relevant methods to attempt to address your question. Design a map that conveys the results of your research. In designing this map look back to the precedent project library here, select a map of an individual map element (legend, scale bar, type of linework etc) and adapt that graphic element for use in your own project.
Upload these final maps here.
- Requirements
- Getting started
- Select by expression: Where are the points of interest that are categorized as department stores located in NYC?
- Spatial join: Which points of interest are located in buildings with Landmark Designation?
- Spatial join with summary statistics: which business improvement district has the most street trees?
- Buffers: Which McDonald’s has the most nearby street trees?
Getting started
Open the .qgz file you created during workshop 1. Save a copy of the QGIS project as workshop2_spatial_questions.qgz.
Turn off the visibility for all layers except the roadbeds and/or curbs and the NYC Points of Interest layer.
Select by expression: Where are the points of interest that are categorized as department stores located in NYC?
To answer this question we will use the NYC Points of Interest dataset. Review the data sources and their metadata in the tutorial for workshop 1..
We will use a tool called Select by Expression to select points of interest from the dataset based on the NAICS code. NAICS stands for North American Industry Classification System and is a data standard for classifying locations and entities based on their industry. There are many levels to the standard, to read more about it look here on the Census Bureau’s website.
The NAICS code for ‘Department Stores’ is 452210 we will use this to select a subset of the Points of Interest dataset.
Open the attribute table for the nyc_poi layer (this is a big dataset so this may take a moment). Take a look at the fields (column names) included in the dataset – information about the name, category, sub-category, NAICS code are available. As mentioned above we will use the NAICS code to select all of the entries categorized as a department store.
Before we do this however we first need to check how the information in this field is stored in the dataset. In other words what is the datatype of the information in the ‘naics_code’ column?
To to this (leave the attribute table open) open the layer properties for the nyc_poi layer (right click on its name in the layers panel then select Properties). When the properties menu opens navigate to the Fields tab. This tells us the name of all fields in the attribute table for the dataset, as well as the giving us information about the type of data contained in each field.
Notice that each field in this dataset is stored as a String (aka text). This matters for the syntax of how we will query the data to find all of the sites marked as department stores. This means that each field is treated as text even if the values in the column are numbers (as is the case with the NAICS code). When ever you are using queries with your spatial data you should check the data type for the field(s) you are going to be working with.
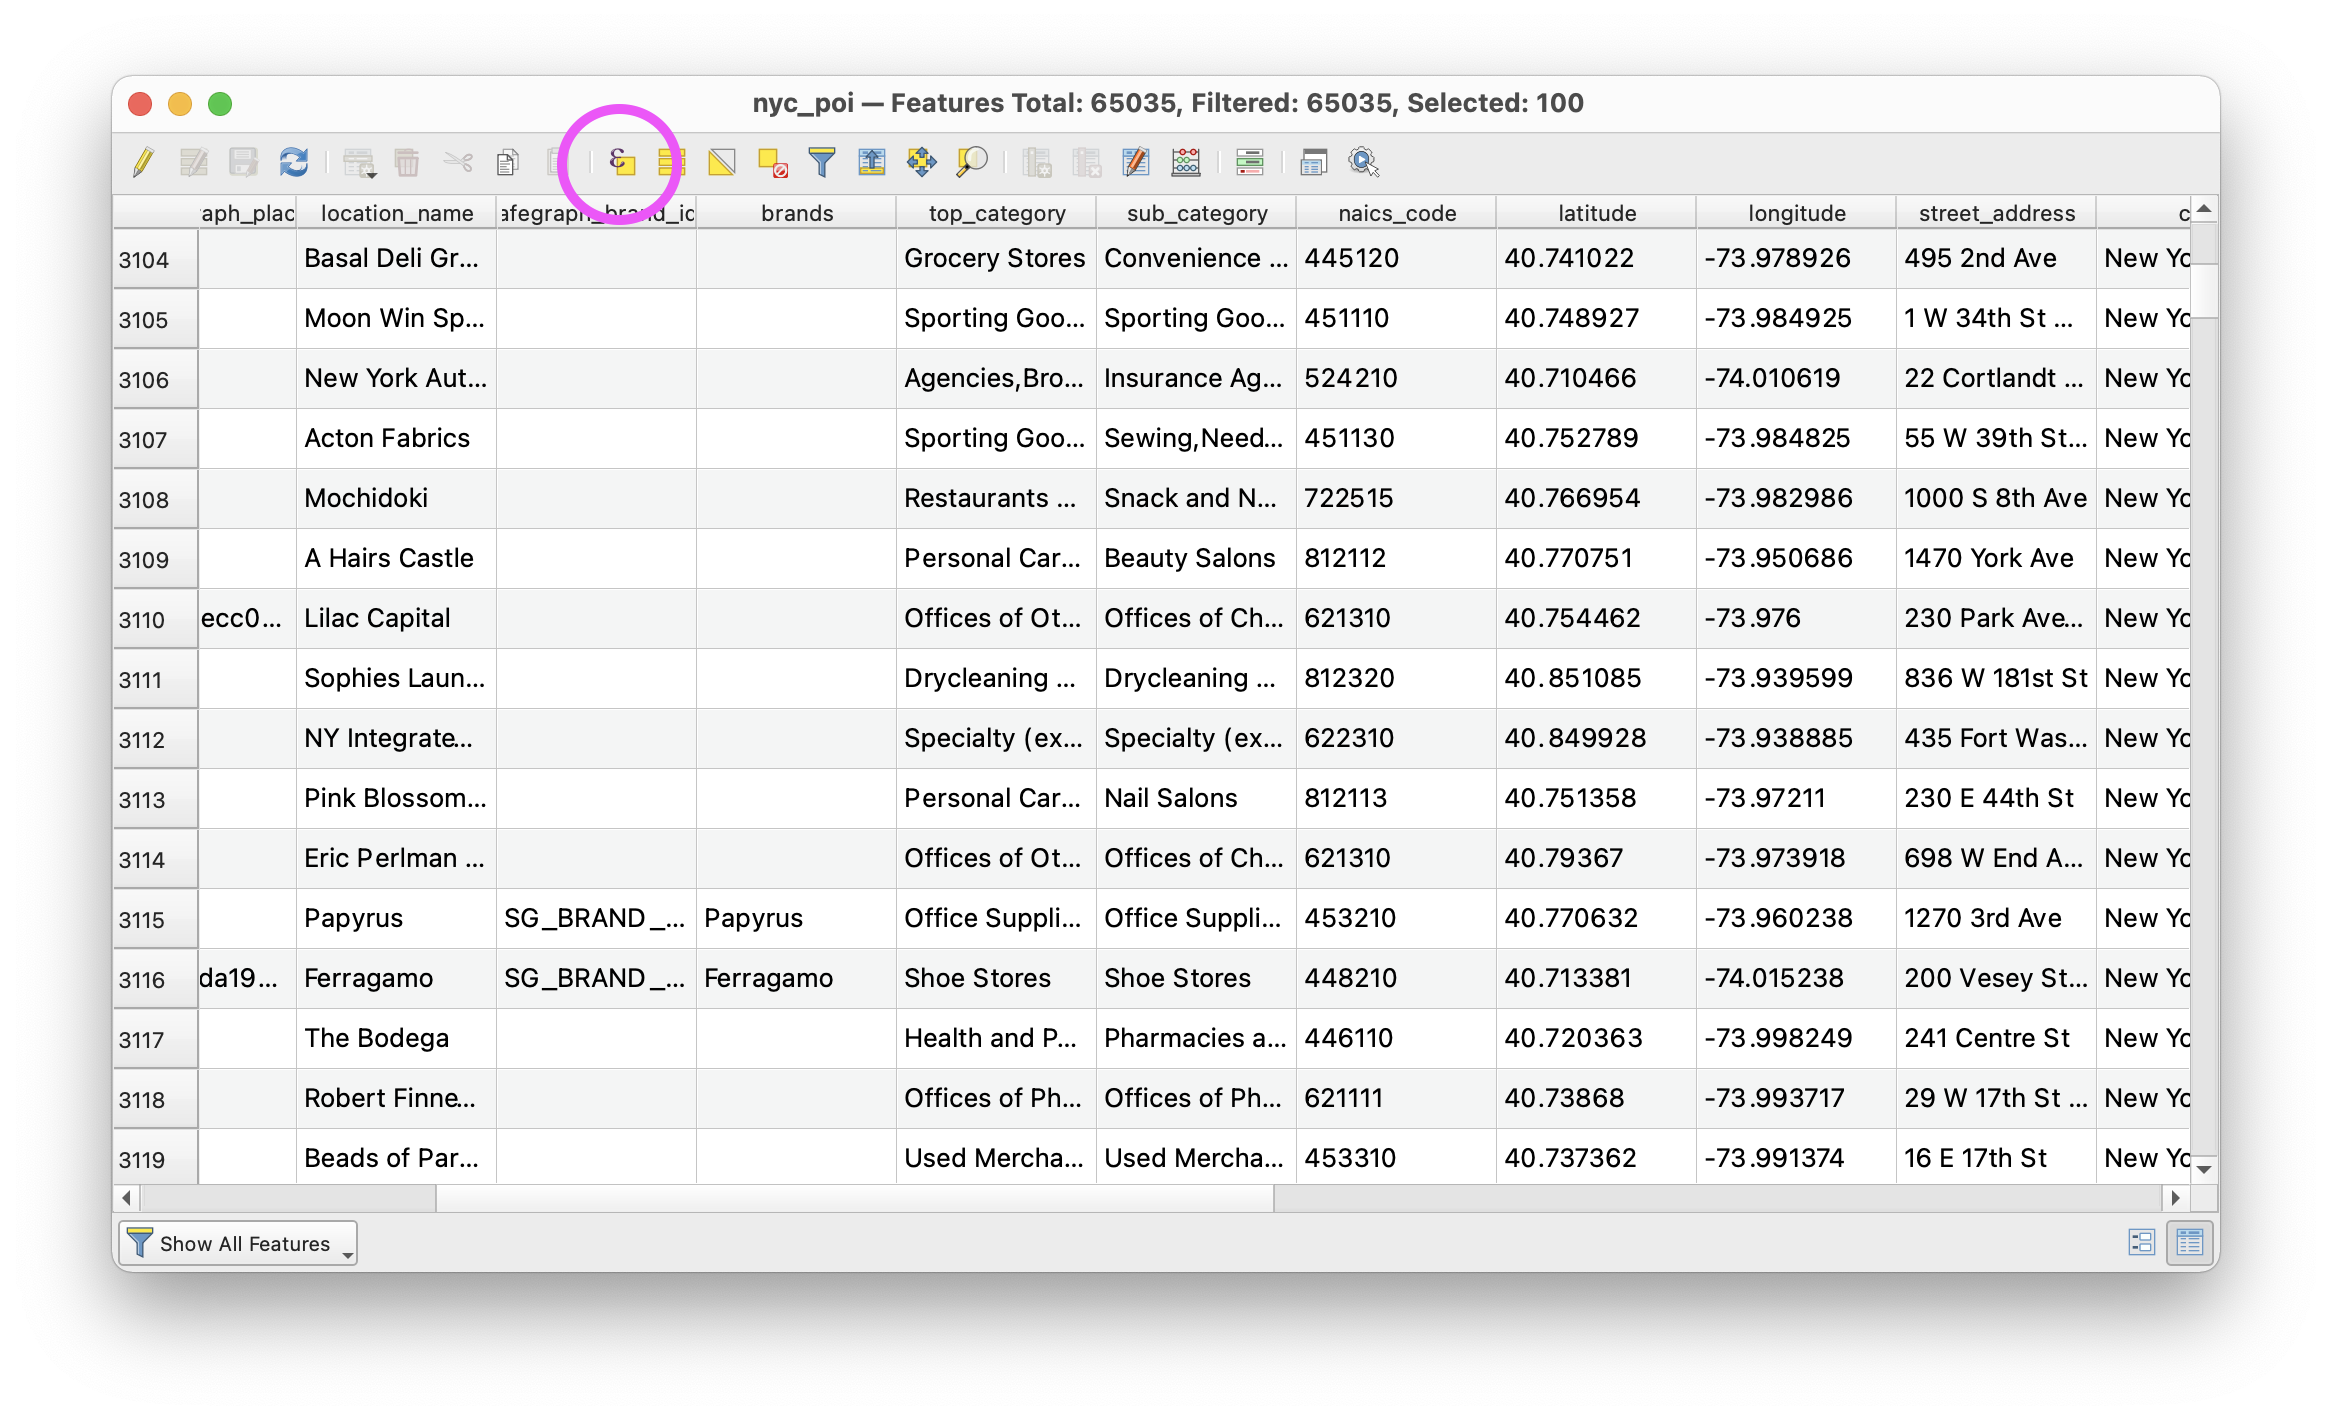
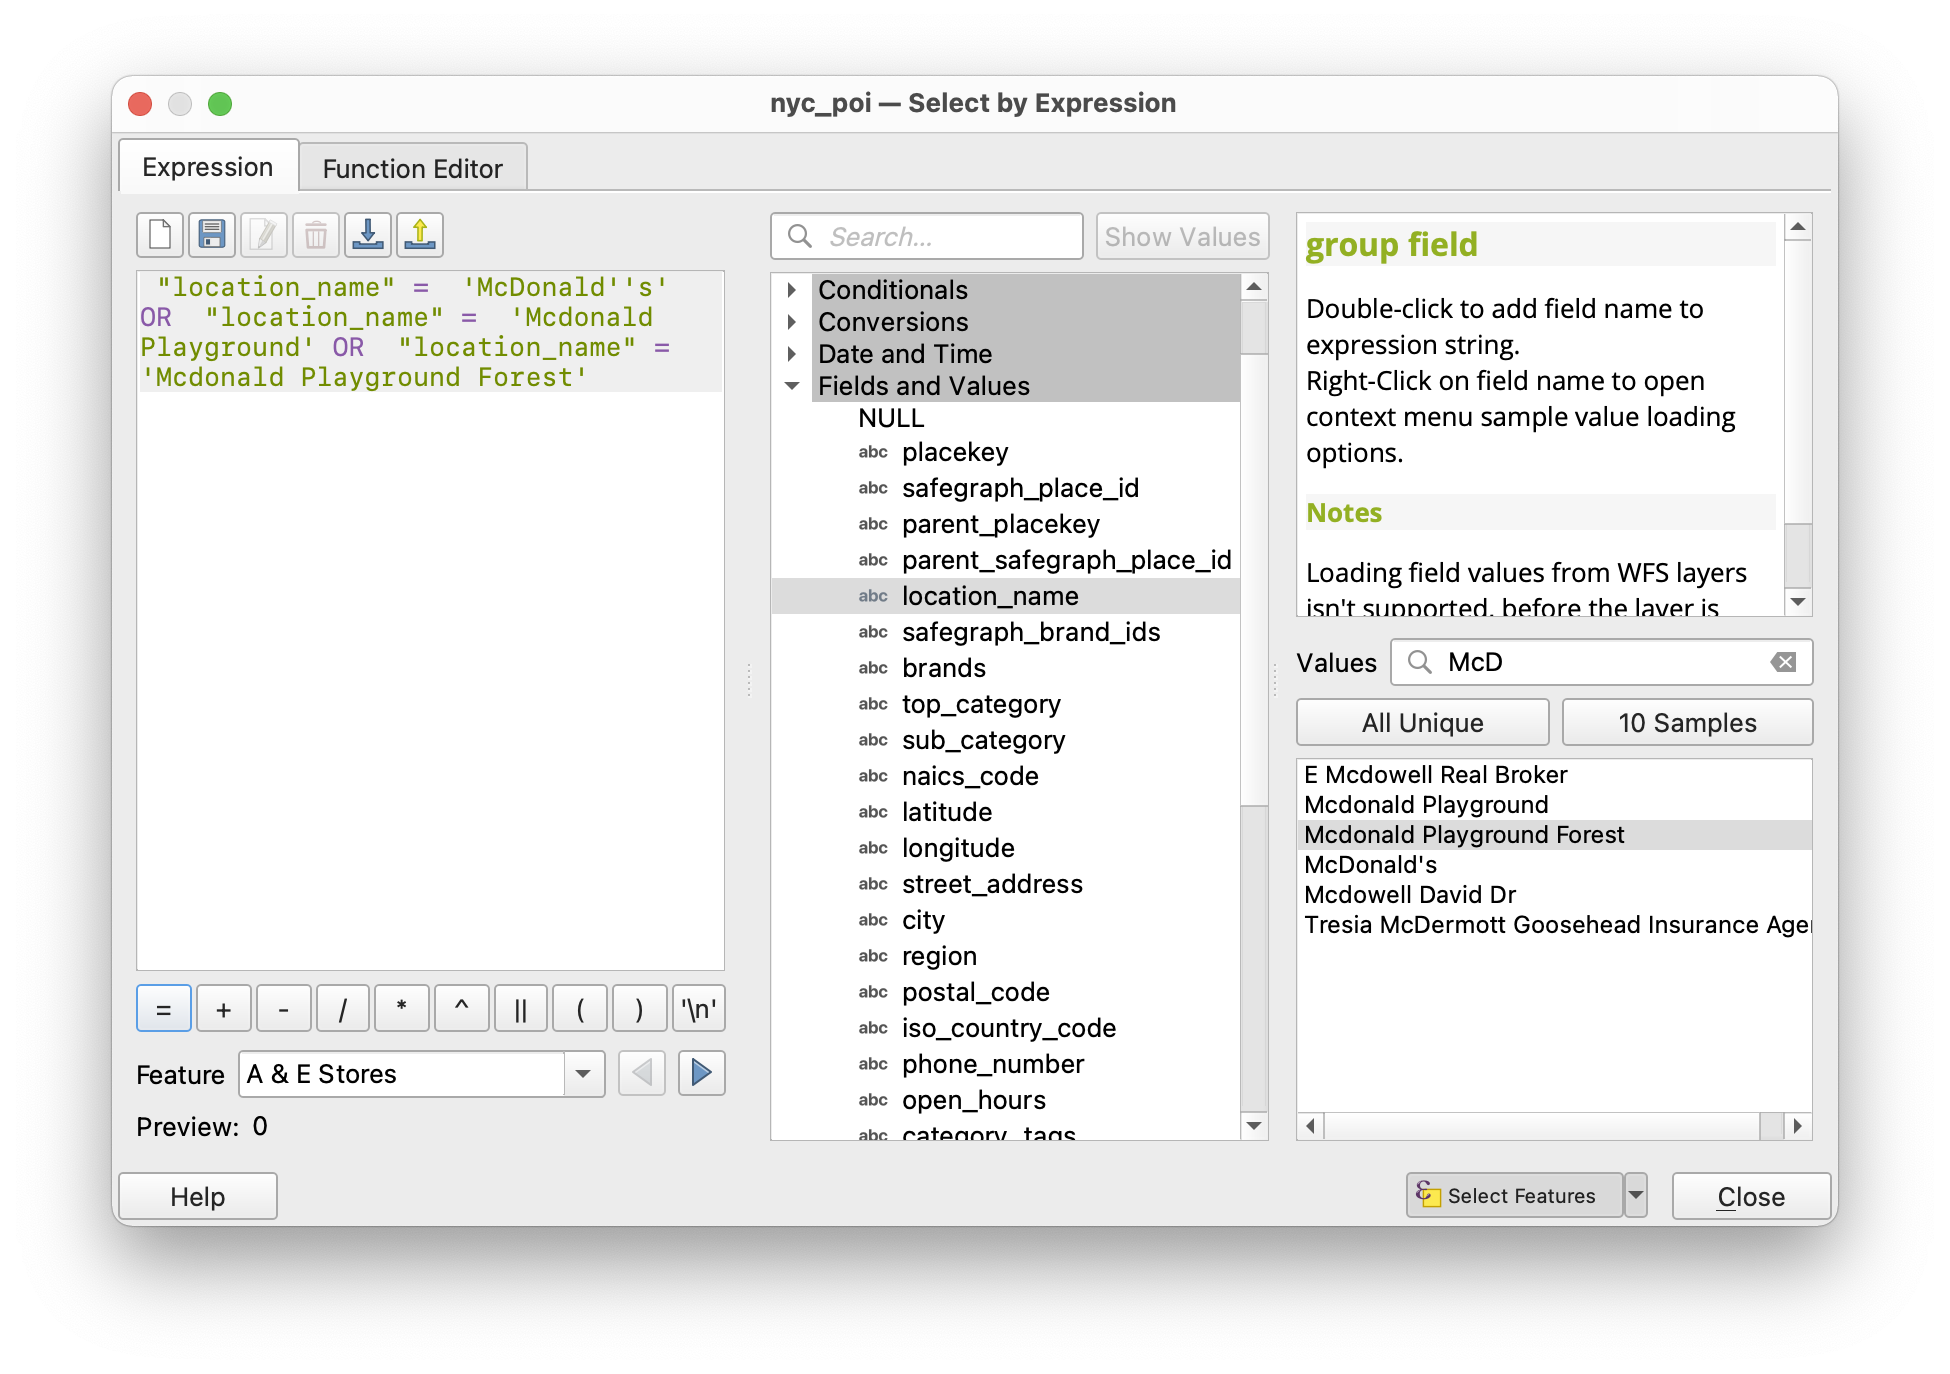
Okay. Now we are ready to use the Select by Expression tool to select those points of interest that have been categorized as department stores. Access the tool through the attribute table for the nyc_poi layer by clicking on the Select by Expression button circled in the screenshot above.
The Select by Expression tool allows us to select all features from a dataset based on some criteria or value contained in their attribute table. In this example we will be querying to find all of the points of interest that have been given the NAICS code for department stores.
When the Select by Expression window opens use the Fields and Values drop down menu to select the naics_code field (double click on it). It will be added to the Expression builder section of the window. Then type ` = ‘452210’`. Make sure that the expression in your window matches exactly with the one in the screenshot below (no extra spaces or characters).
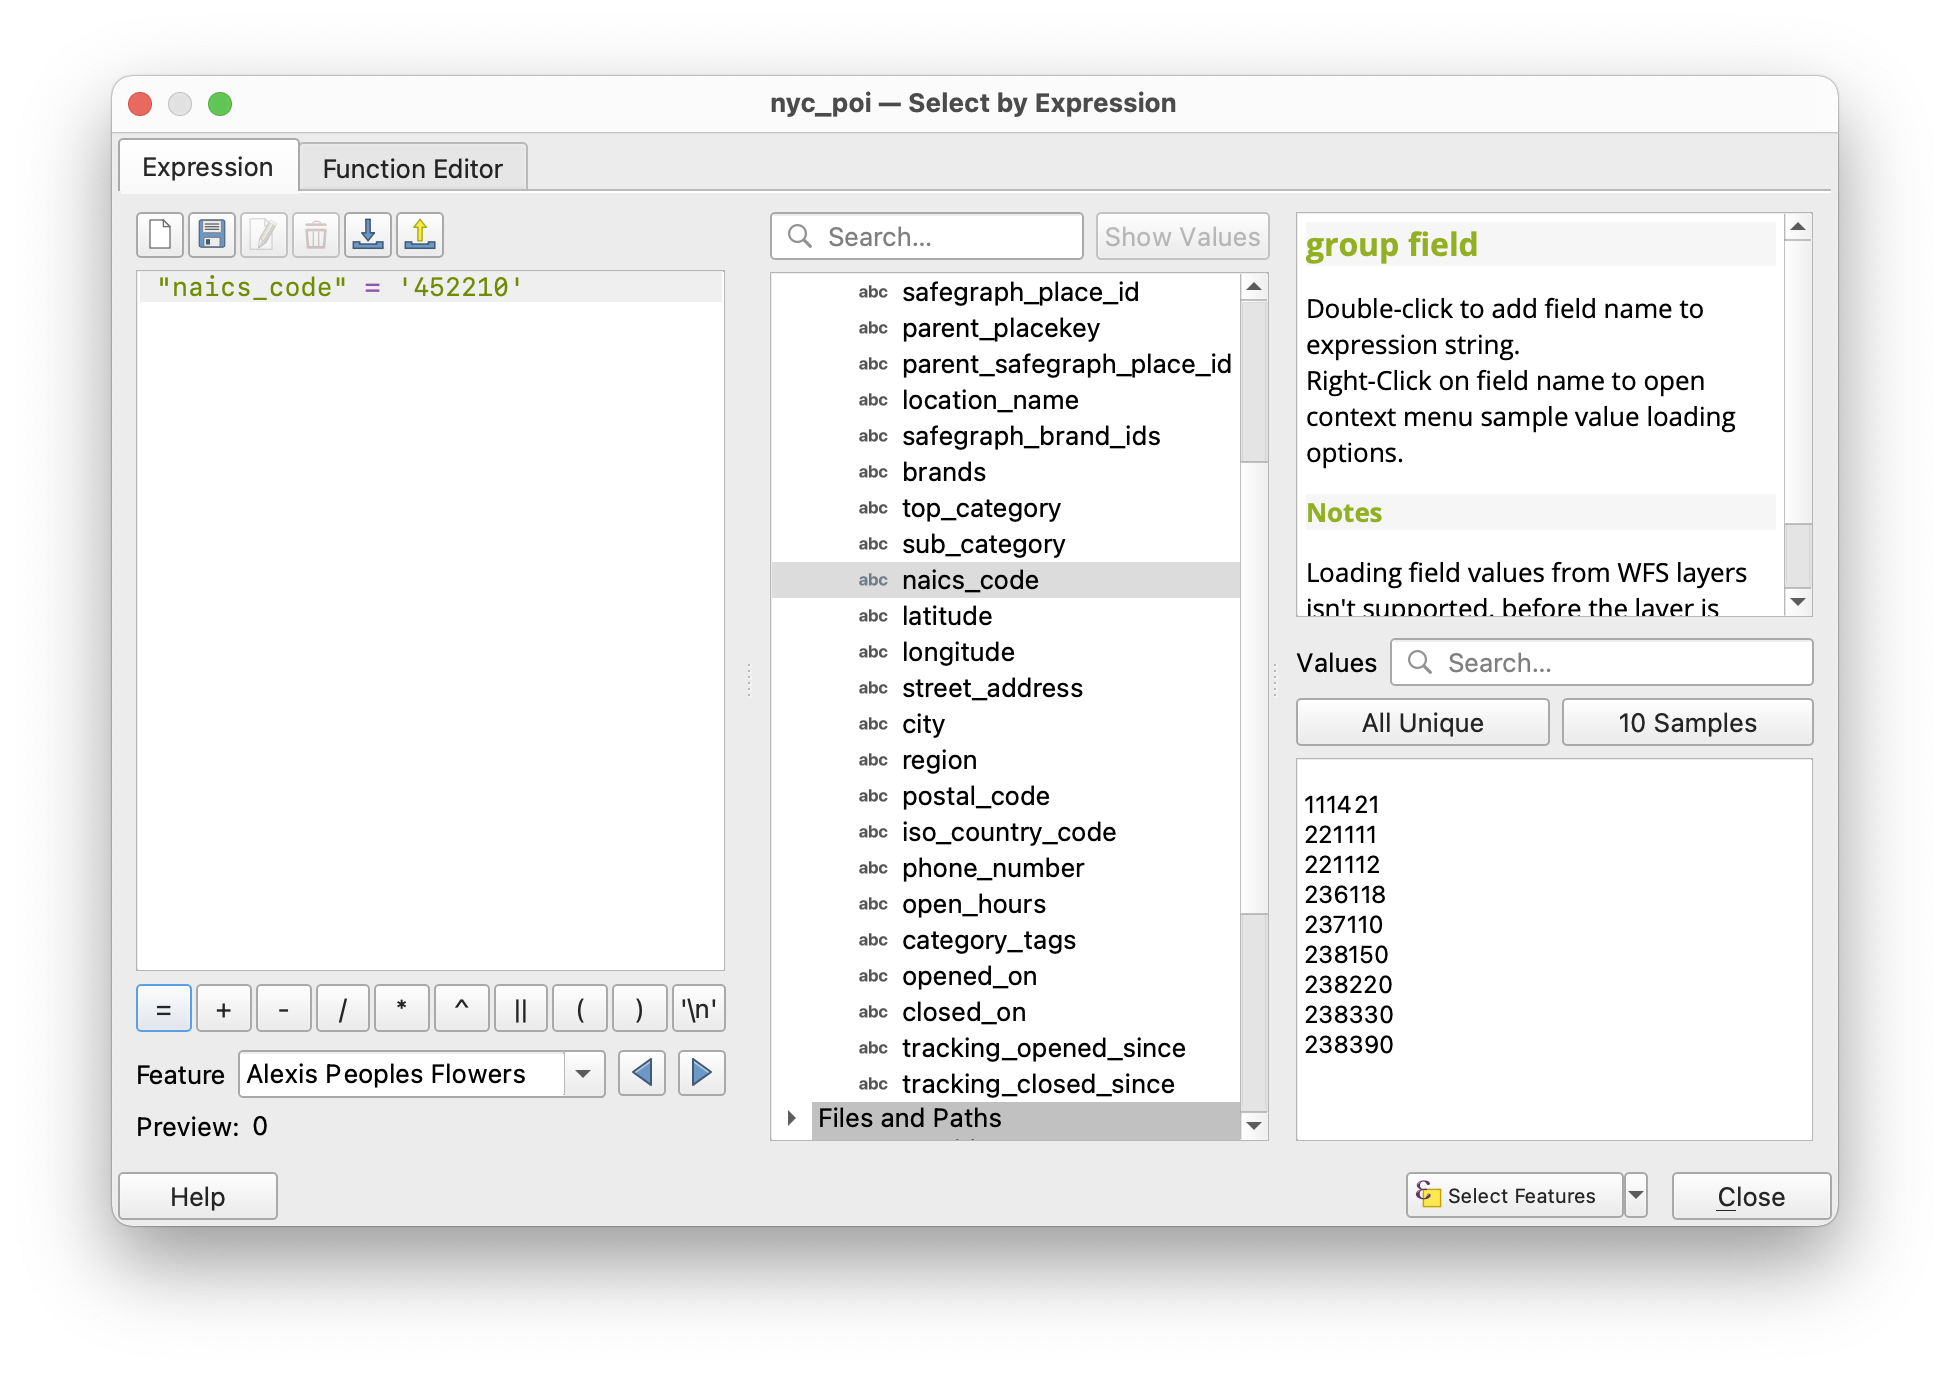
Once your expression is correct click Select Features. It may take a few seconds to run, be patient.
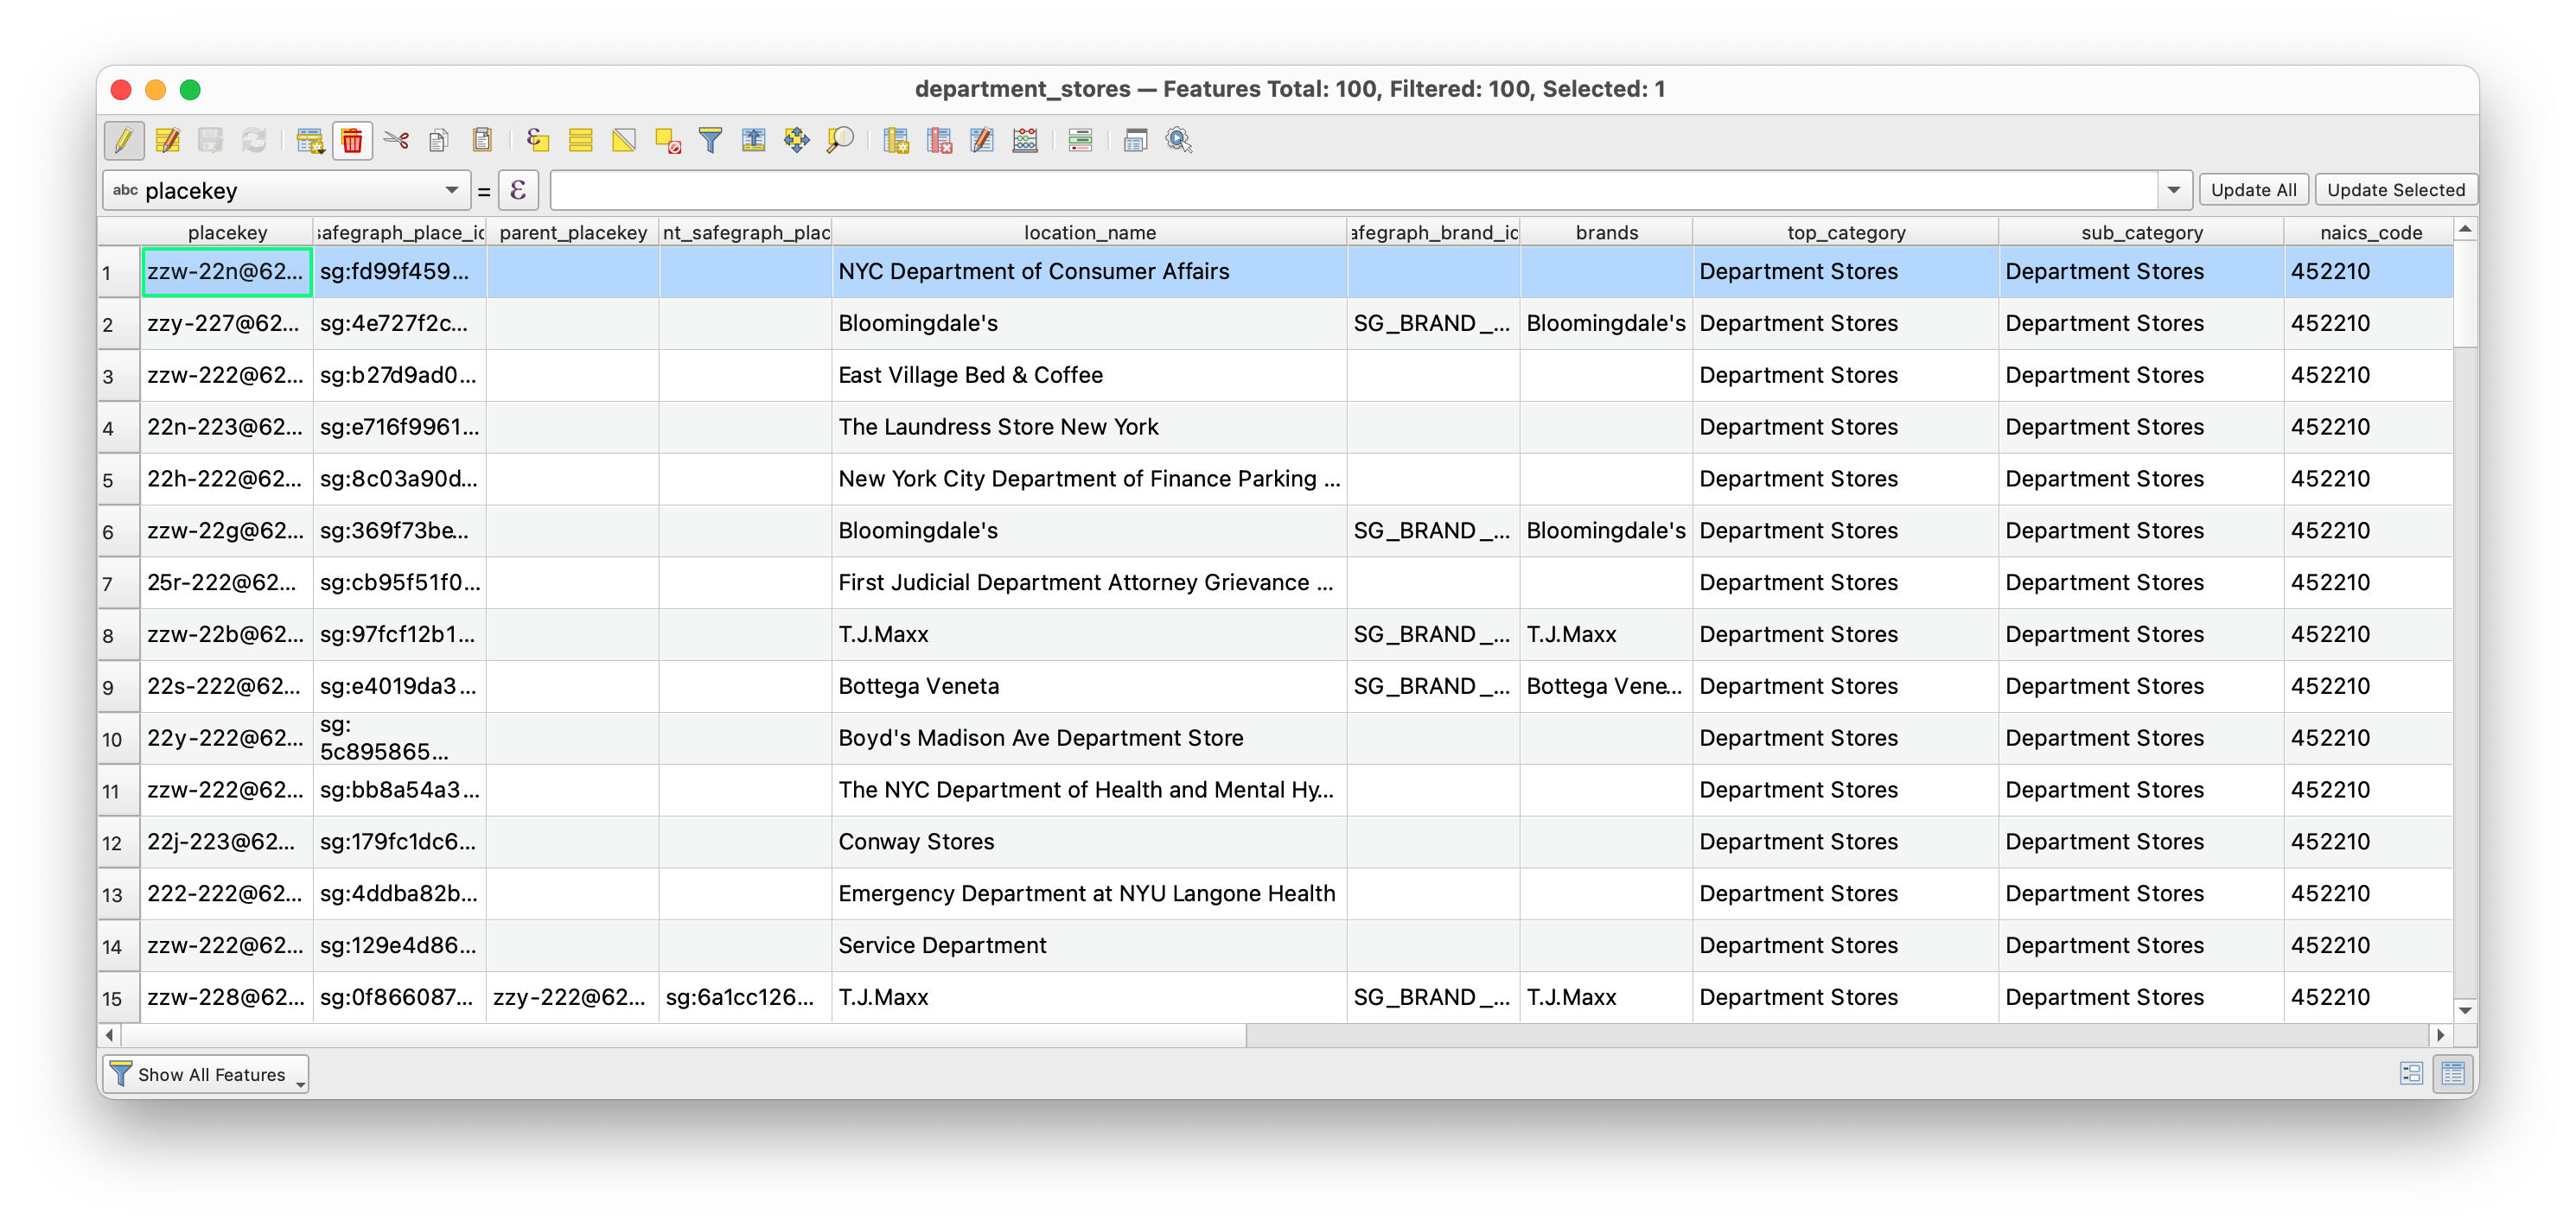
Close the Select by Expression window you should see that 100 features from the nyc_poi layer have been selected.
Save your QGIS project.
Next export these selected features as a new layer. Right click on the nyc_poi layer in the Layers Panel, Export>Save Selected Features As then save the new dataset in the folder where you are keeping spatial data for this course. Save the file as a geojson and name it department_stores.geojson.
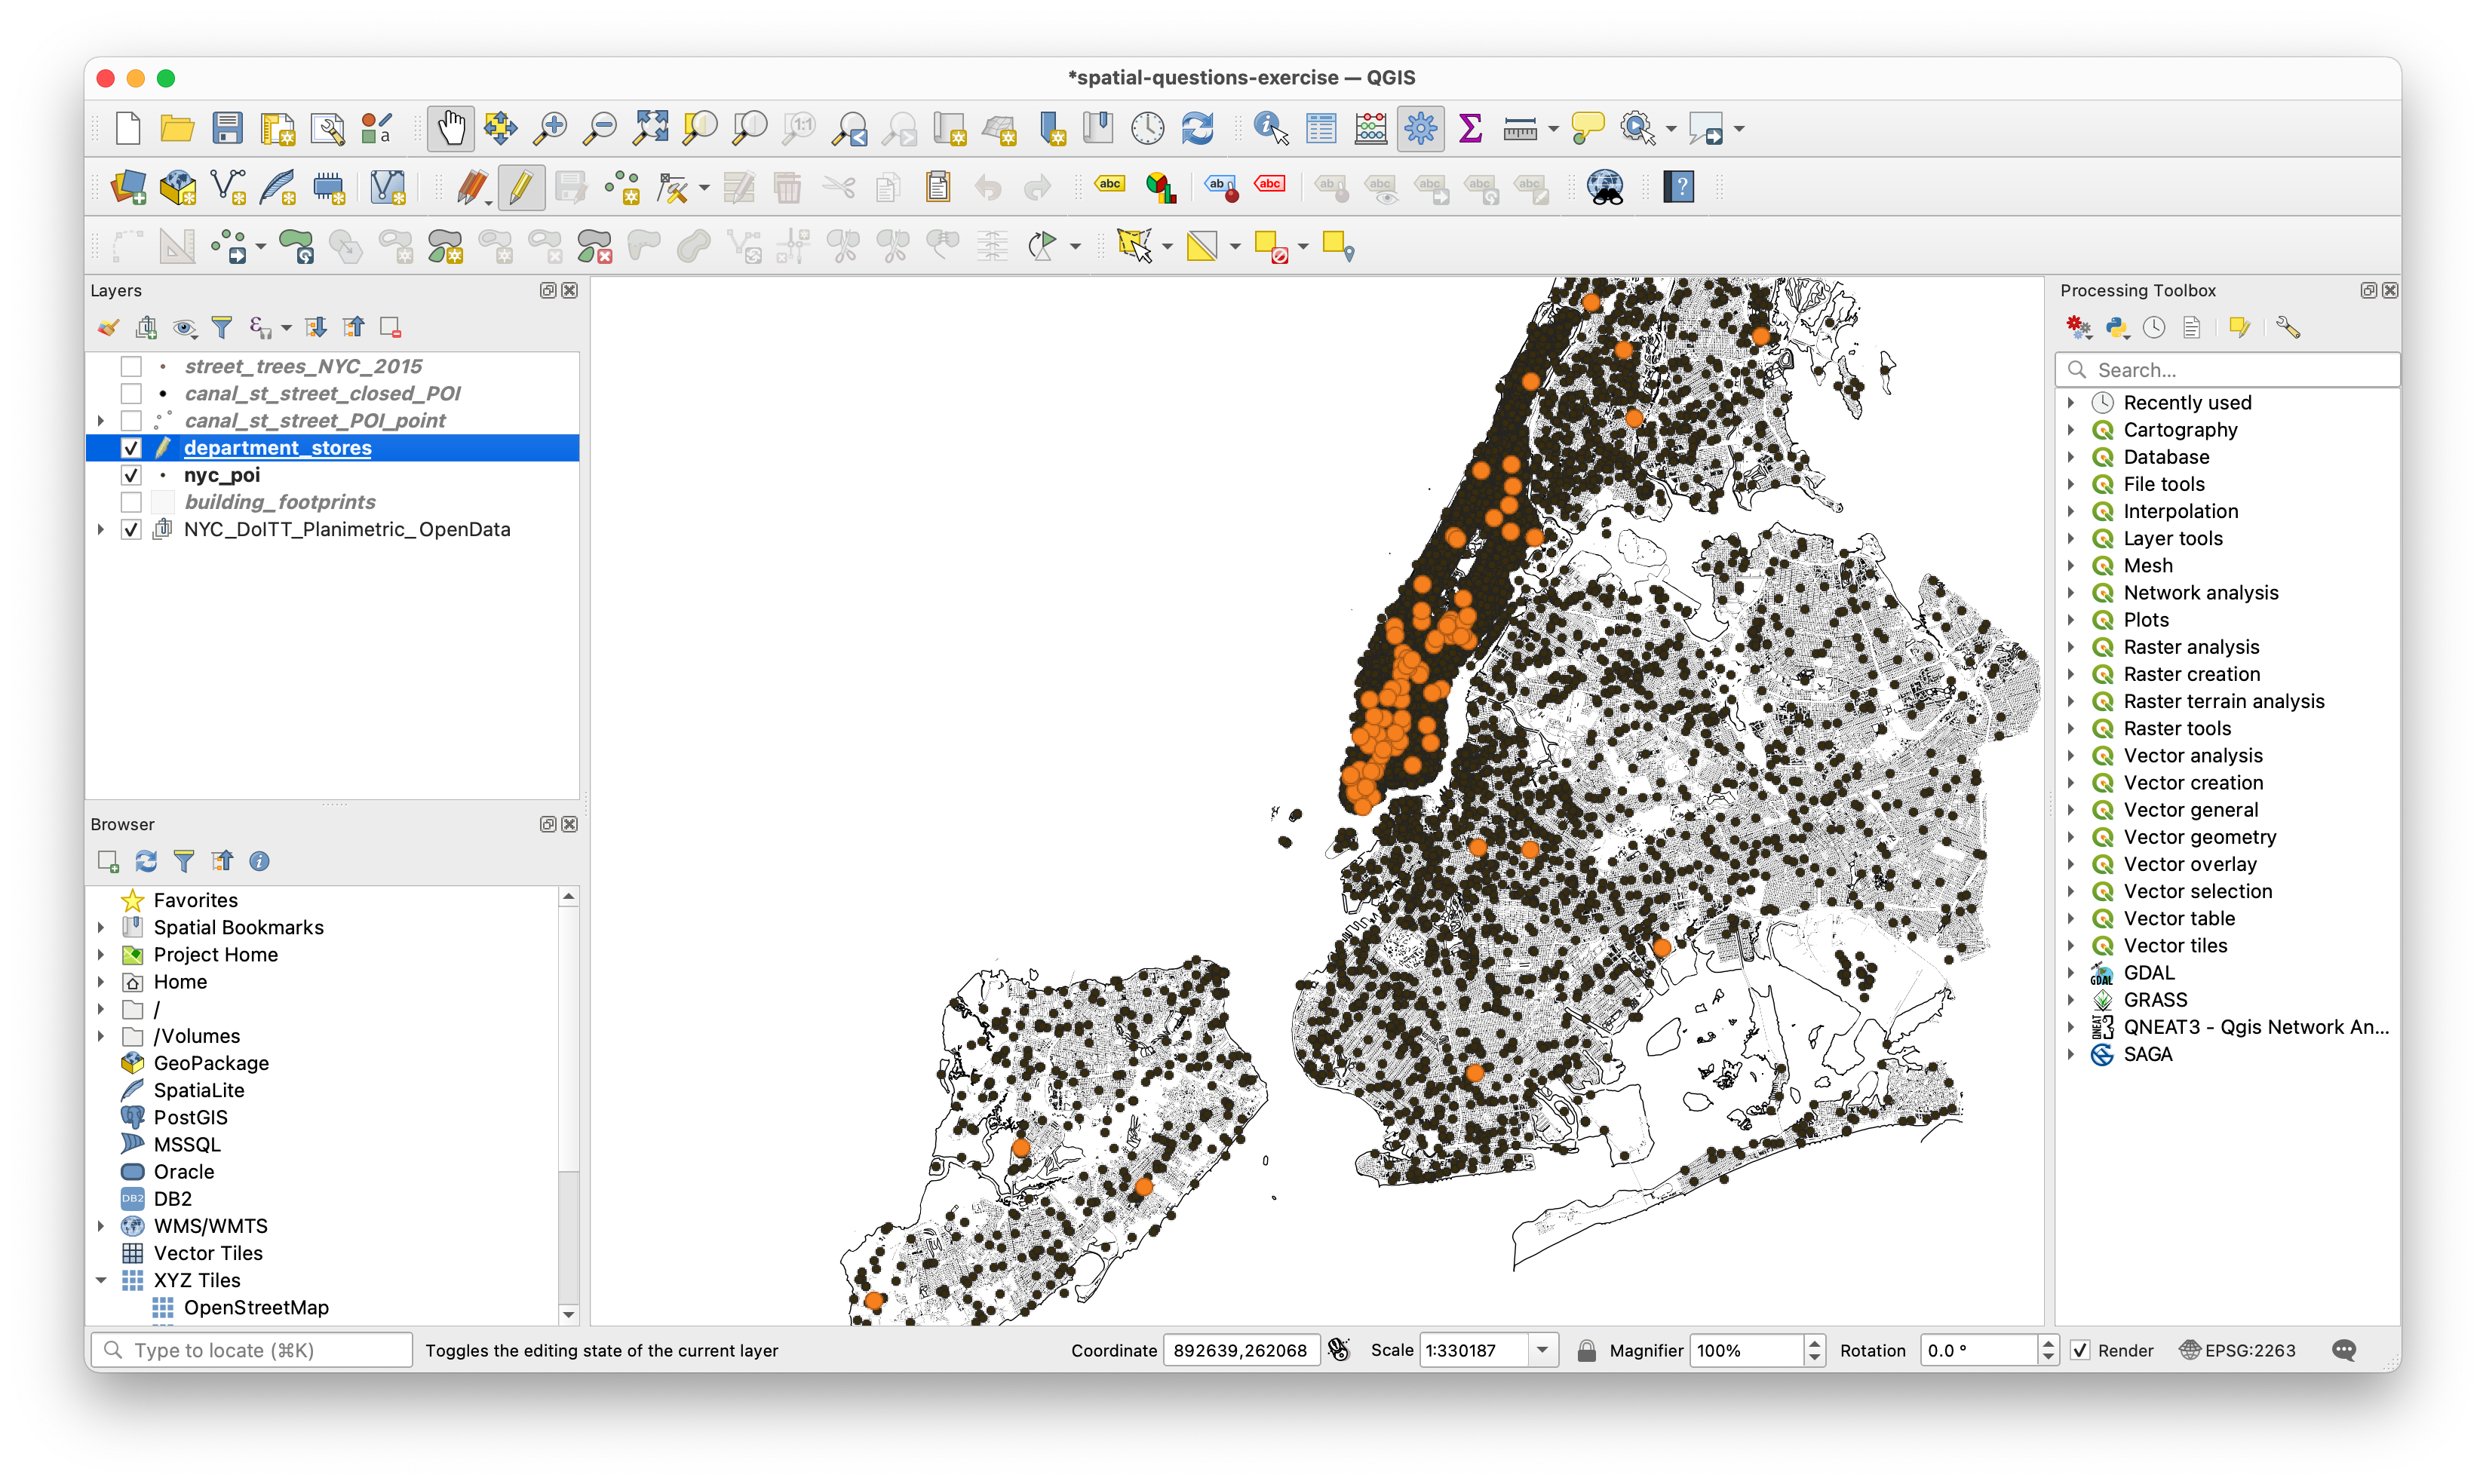
Once the new layer is added to your QGIS project change the layer symbology so that the locations categorized as department stores are clearly visible on your map. Then open the attribute table for this new layer.
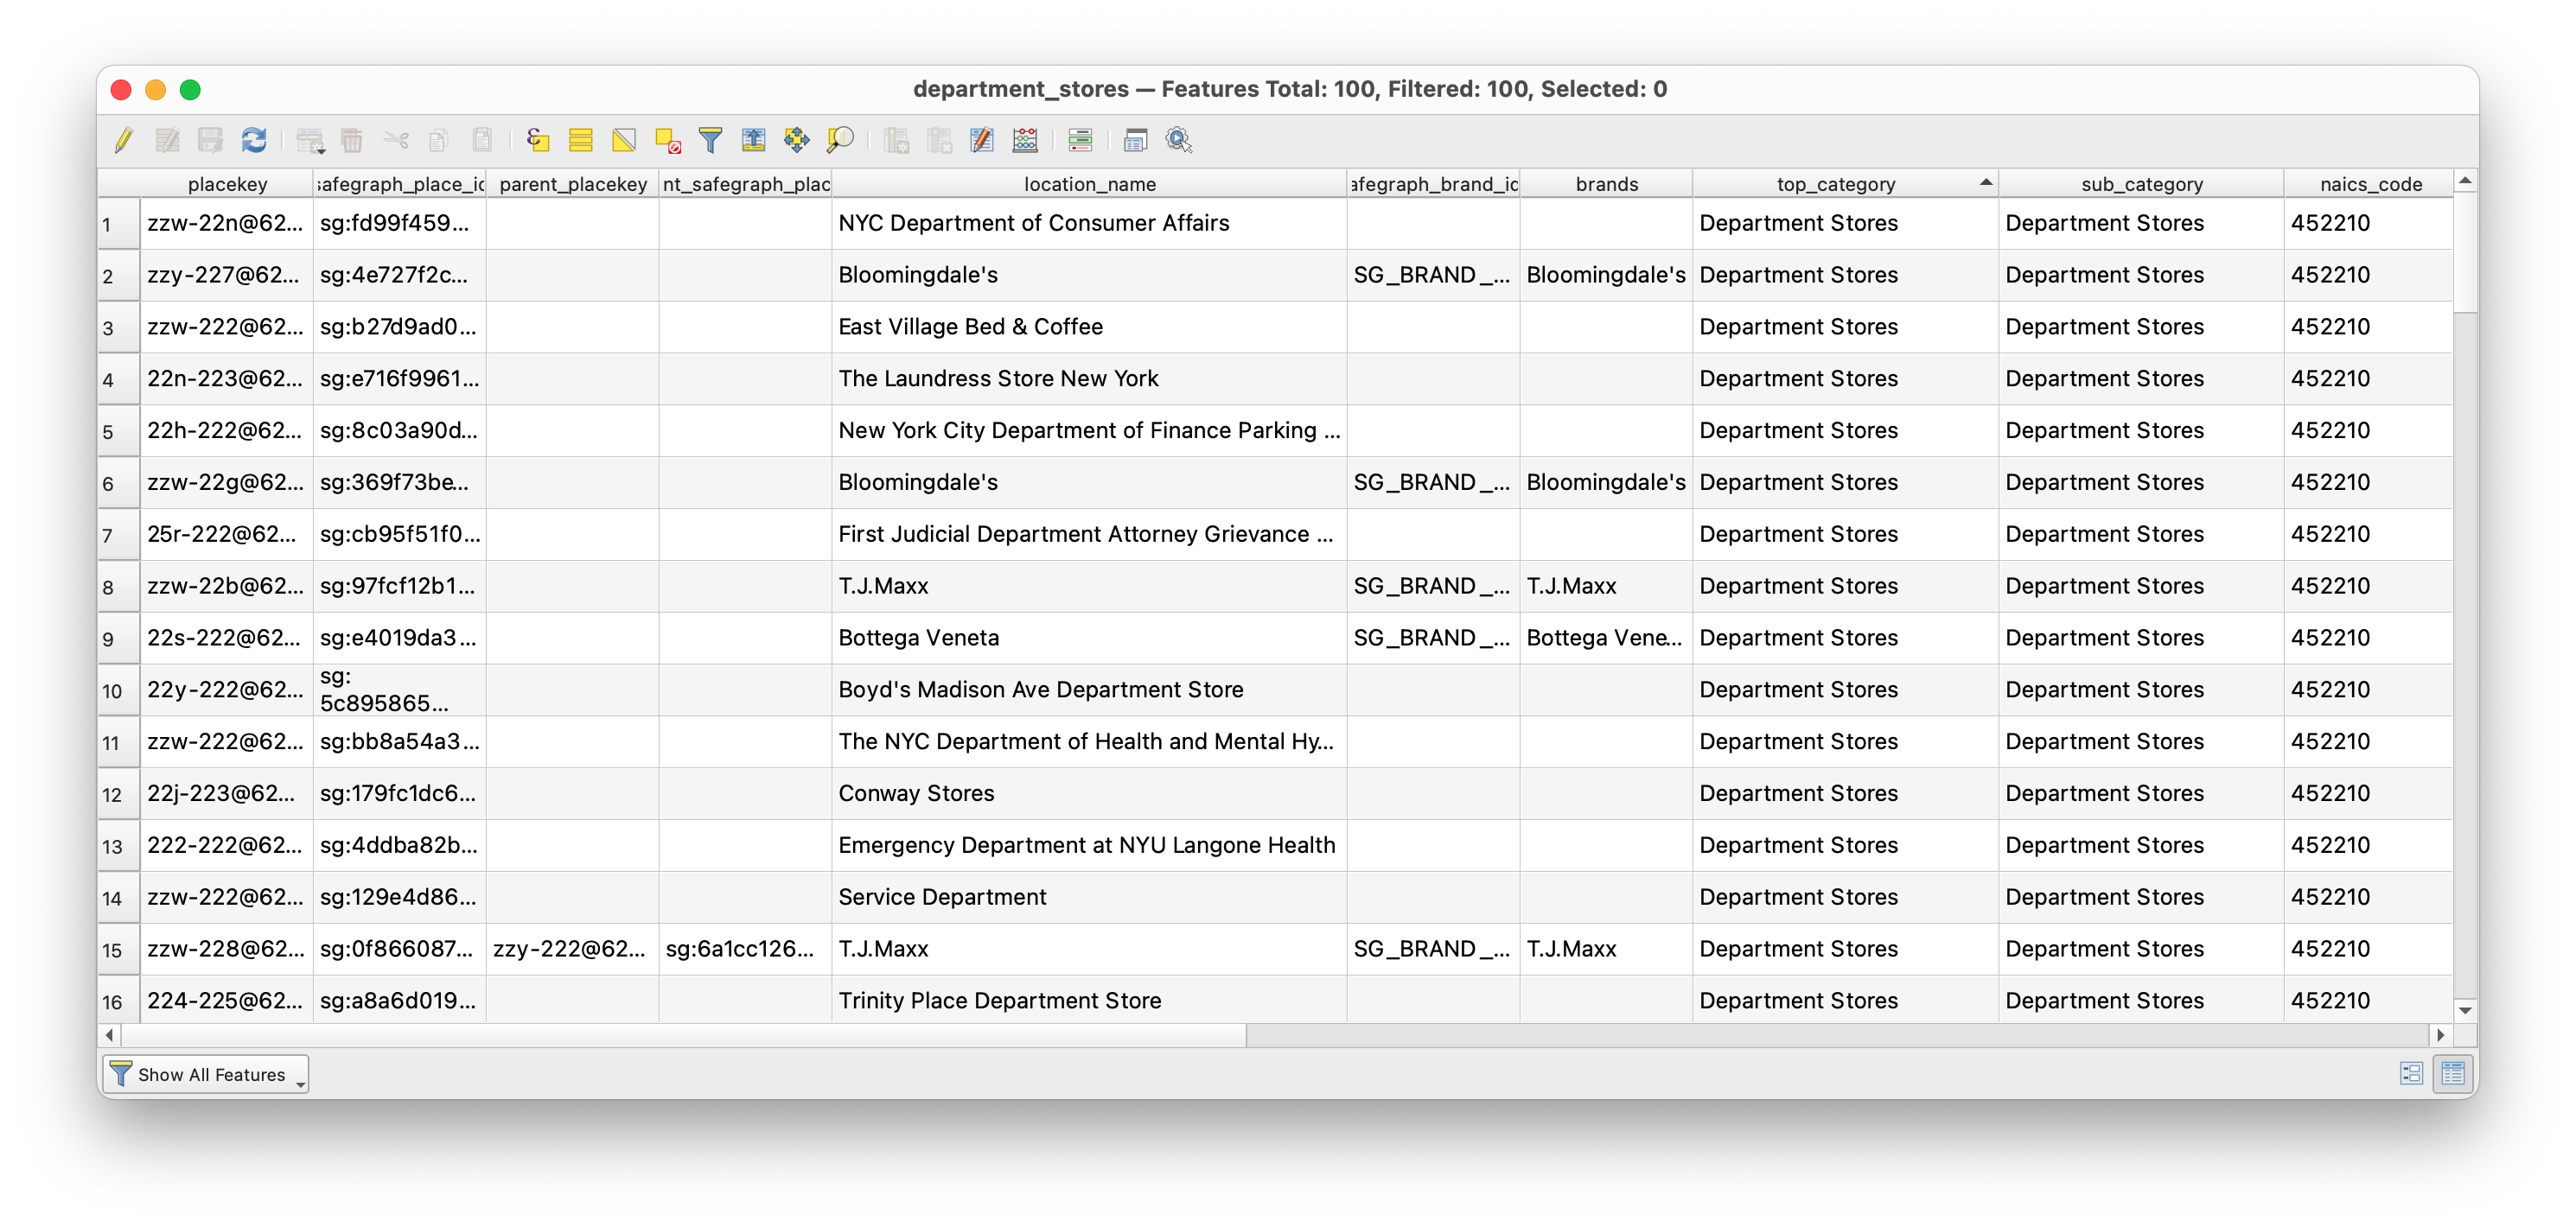
Notice that not all of the features here are department stores! but instead many are locations with the word “department” in their name. For example the Department of Sanitation, and a number of other NYC Government agencies show up as a result of this.
This is a great illustration of the limits of large datasets based on collected and then categorized information. Safegraph describes their method for assigning NAICS codes here. Because it is a proprietary dataset SafeGraph does not publish extensive documentation of their methods (this is often a major limitation to proprietary datasets beyond issues of cost).
If you were to continue to try to map department stores for NYC you should carefully look through all of the features included in with this NAICS code and then manually eliminate records that do not belong.
To do this begin an Editing Session so that you can modify the dataset. With the department stores layer selected in the layers panel click on the Toggle Editing button. A pencil icon will show up next to the layer name in the layers panel. This means you can now edit / delete features in this dataset.
Now open the attribute table for the department stores layer. Select the rows that contain mis categorized entries by clicking on the index number for each row at the left of the table, then delete mis-categorized features.
 When you have finished toggle the editing session off and save your changes when prompted.
Save your QGIS project.
Follow these same steps to find another type of retailer or specific store. (For example all of the McDonald’s?)
Save your QGIS project.
Spatial join: Which points of interest are located in buildings with Landmark Designation?
Download the Landmarks and Preservation Commission database of Individual Landmark and Historic District Buildings here.
Once this dataset has downloaded save it to your data folder for this workshop. Add it to your QGIS map project.
Open the attribute table for the layer. Notice that the “hist_dist” field contains the name of the historic district that each building falls within, or designates it as a building that is an individual landmark. To learn more about Landmark Designation see this FAQ from the Landmarks Preservation Commission.
Here we want to find out how many buildings that are Individaul Landmarks contain businesses included in the points of interest dataset.
First we will select just those buildings that are individual landmarks. Use the Select by Expression as we did above in order to do this. Construct the following expression:
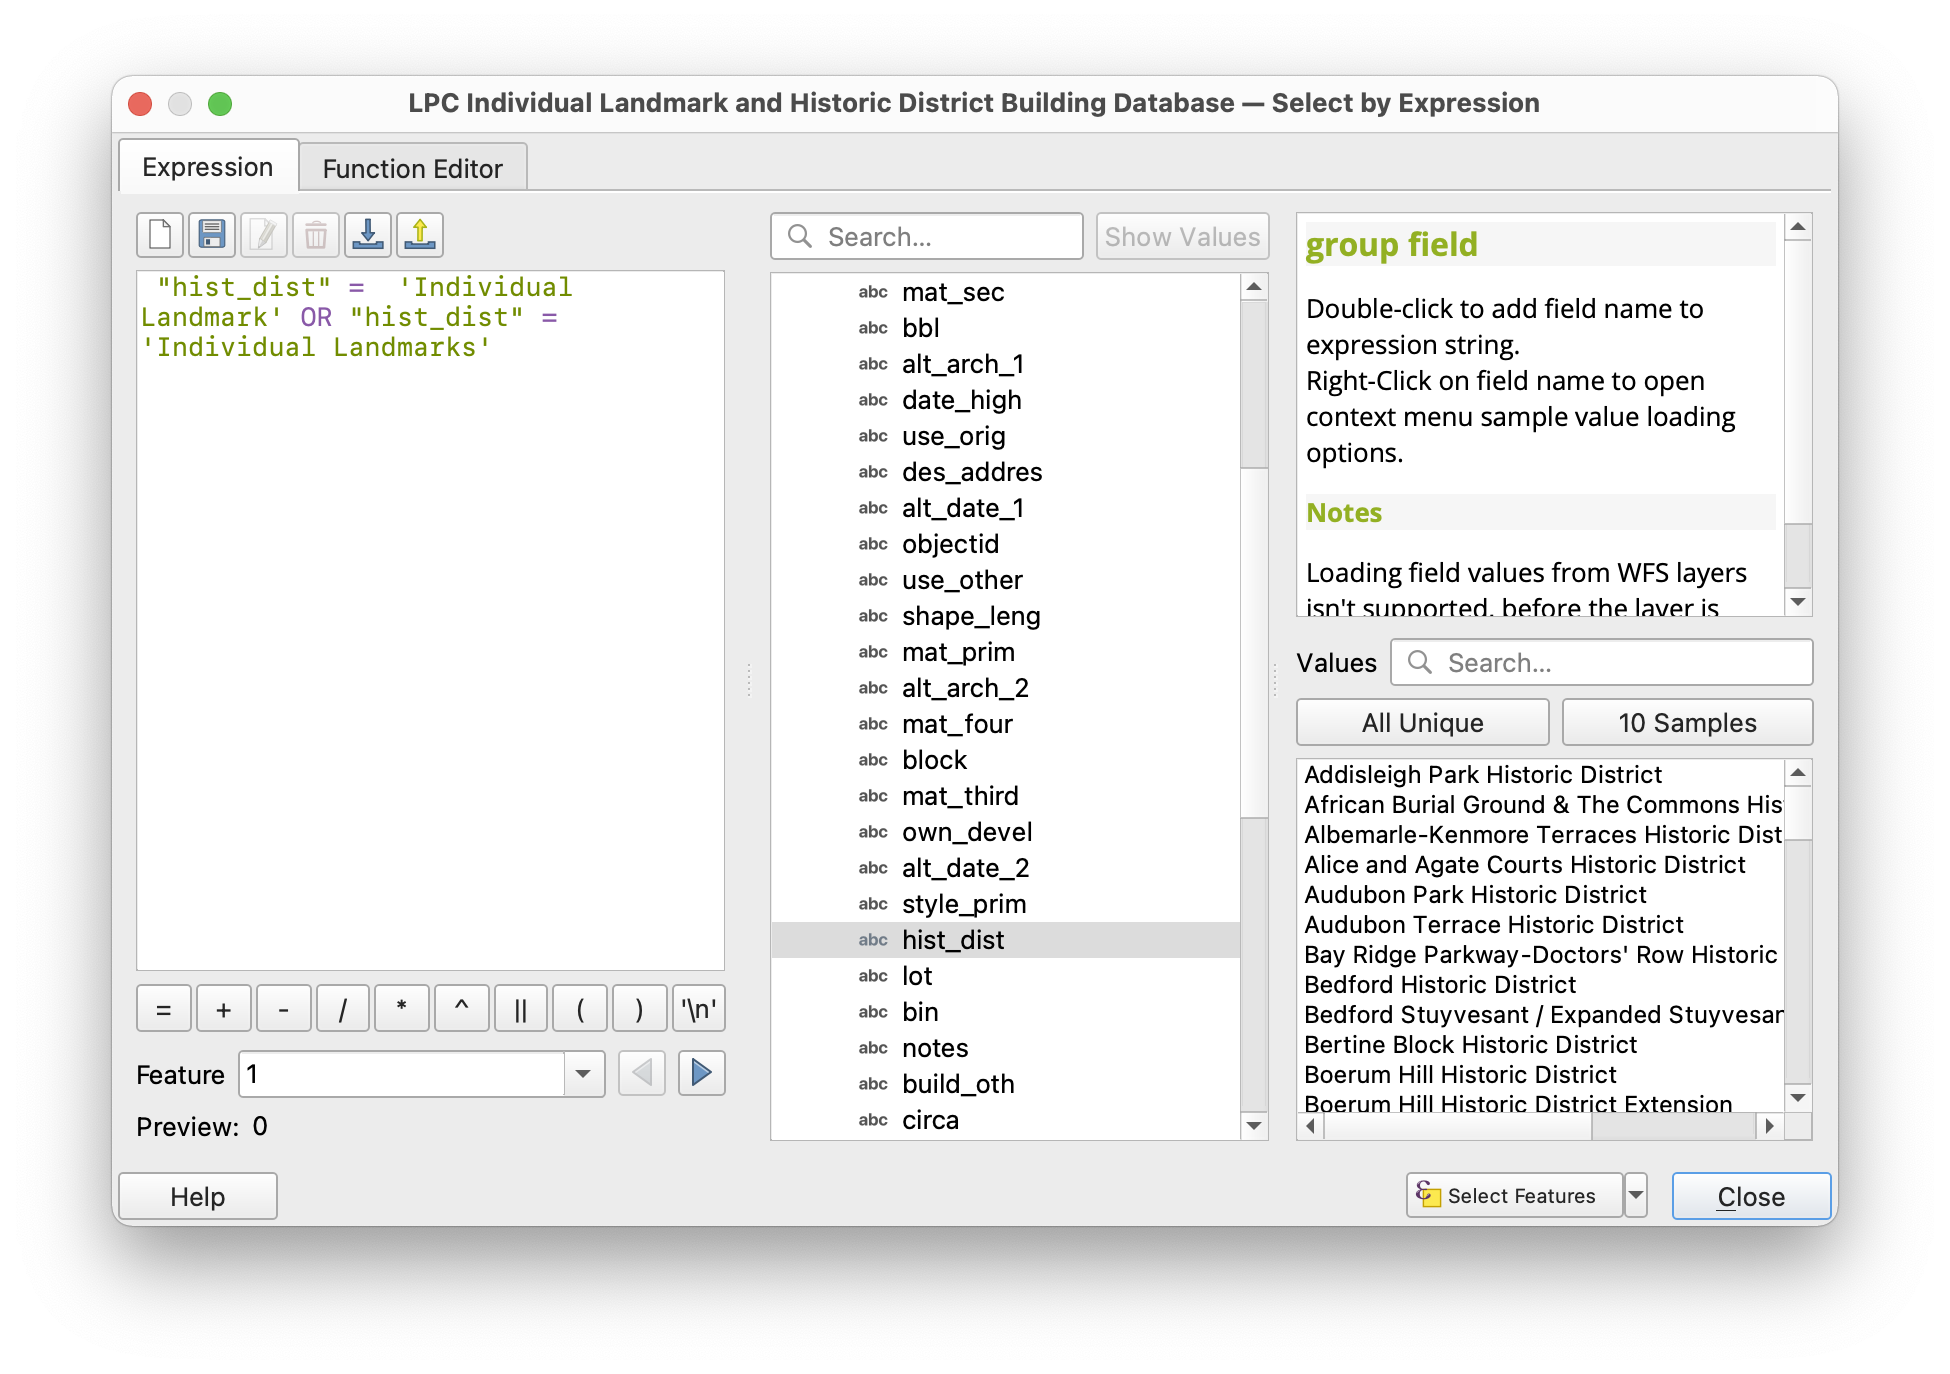
(1718 features should be selected.)
Export these as a new dataset of Landmarked buildings, save as landmarked_buildings.shp. Make sure to select EPSG: 2263 as the coordinate reference system, and shapefile as the file type.
Save your QGIS project.
Now we will use a powerful method called a spatial join to associate information from the landmarked buildings dataset with point of interest locations.
In a spatial join we are using the geometric and geographic relationships between two data layers to associate attribute information from one dataset with the attribute table for the other. In a spatial join, the order matters and will impact the results of the spatial join.
The diagram below illustrates a spatial join in concept:
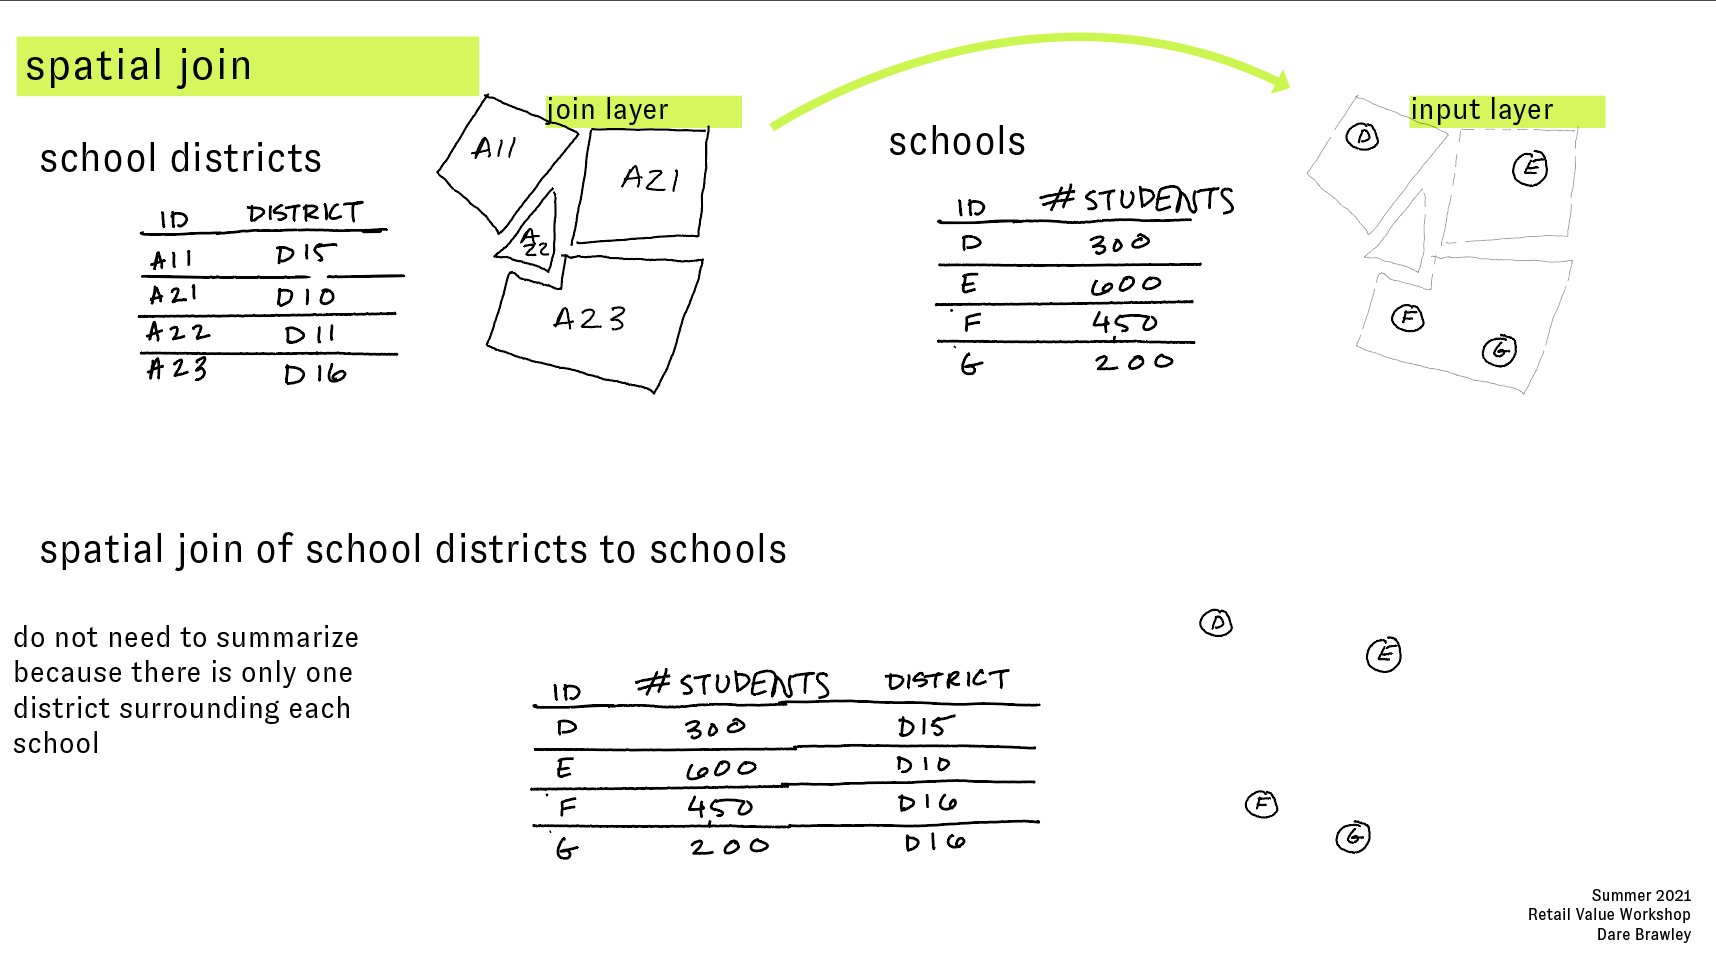
In our case the schools are the points of interest and the districts are the building footprints for buildings with Landmark Designation.
Okay lets begin.
To help speed up the processing time first we will change the file type of the NYC points of interest to a shape file. This is a bit technical but this file type is optimized for operations like this and has something called a ‘spatial index’ that allows for faster processing times. Right click on the nyc_poi layer in the layers panel select Export>Save features as then select a location to save the file, and choose shapefile as the file type.
Remove the previous version of the nyc_poi layer.
Now, in the Vector menu open Data management tools>Join features by location then make the following selections:
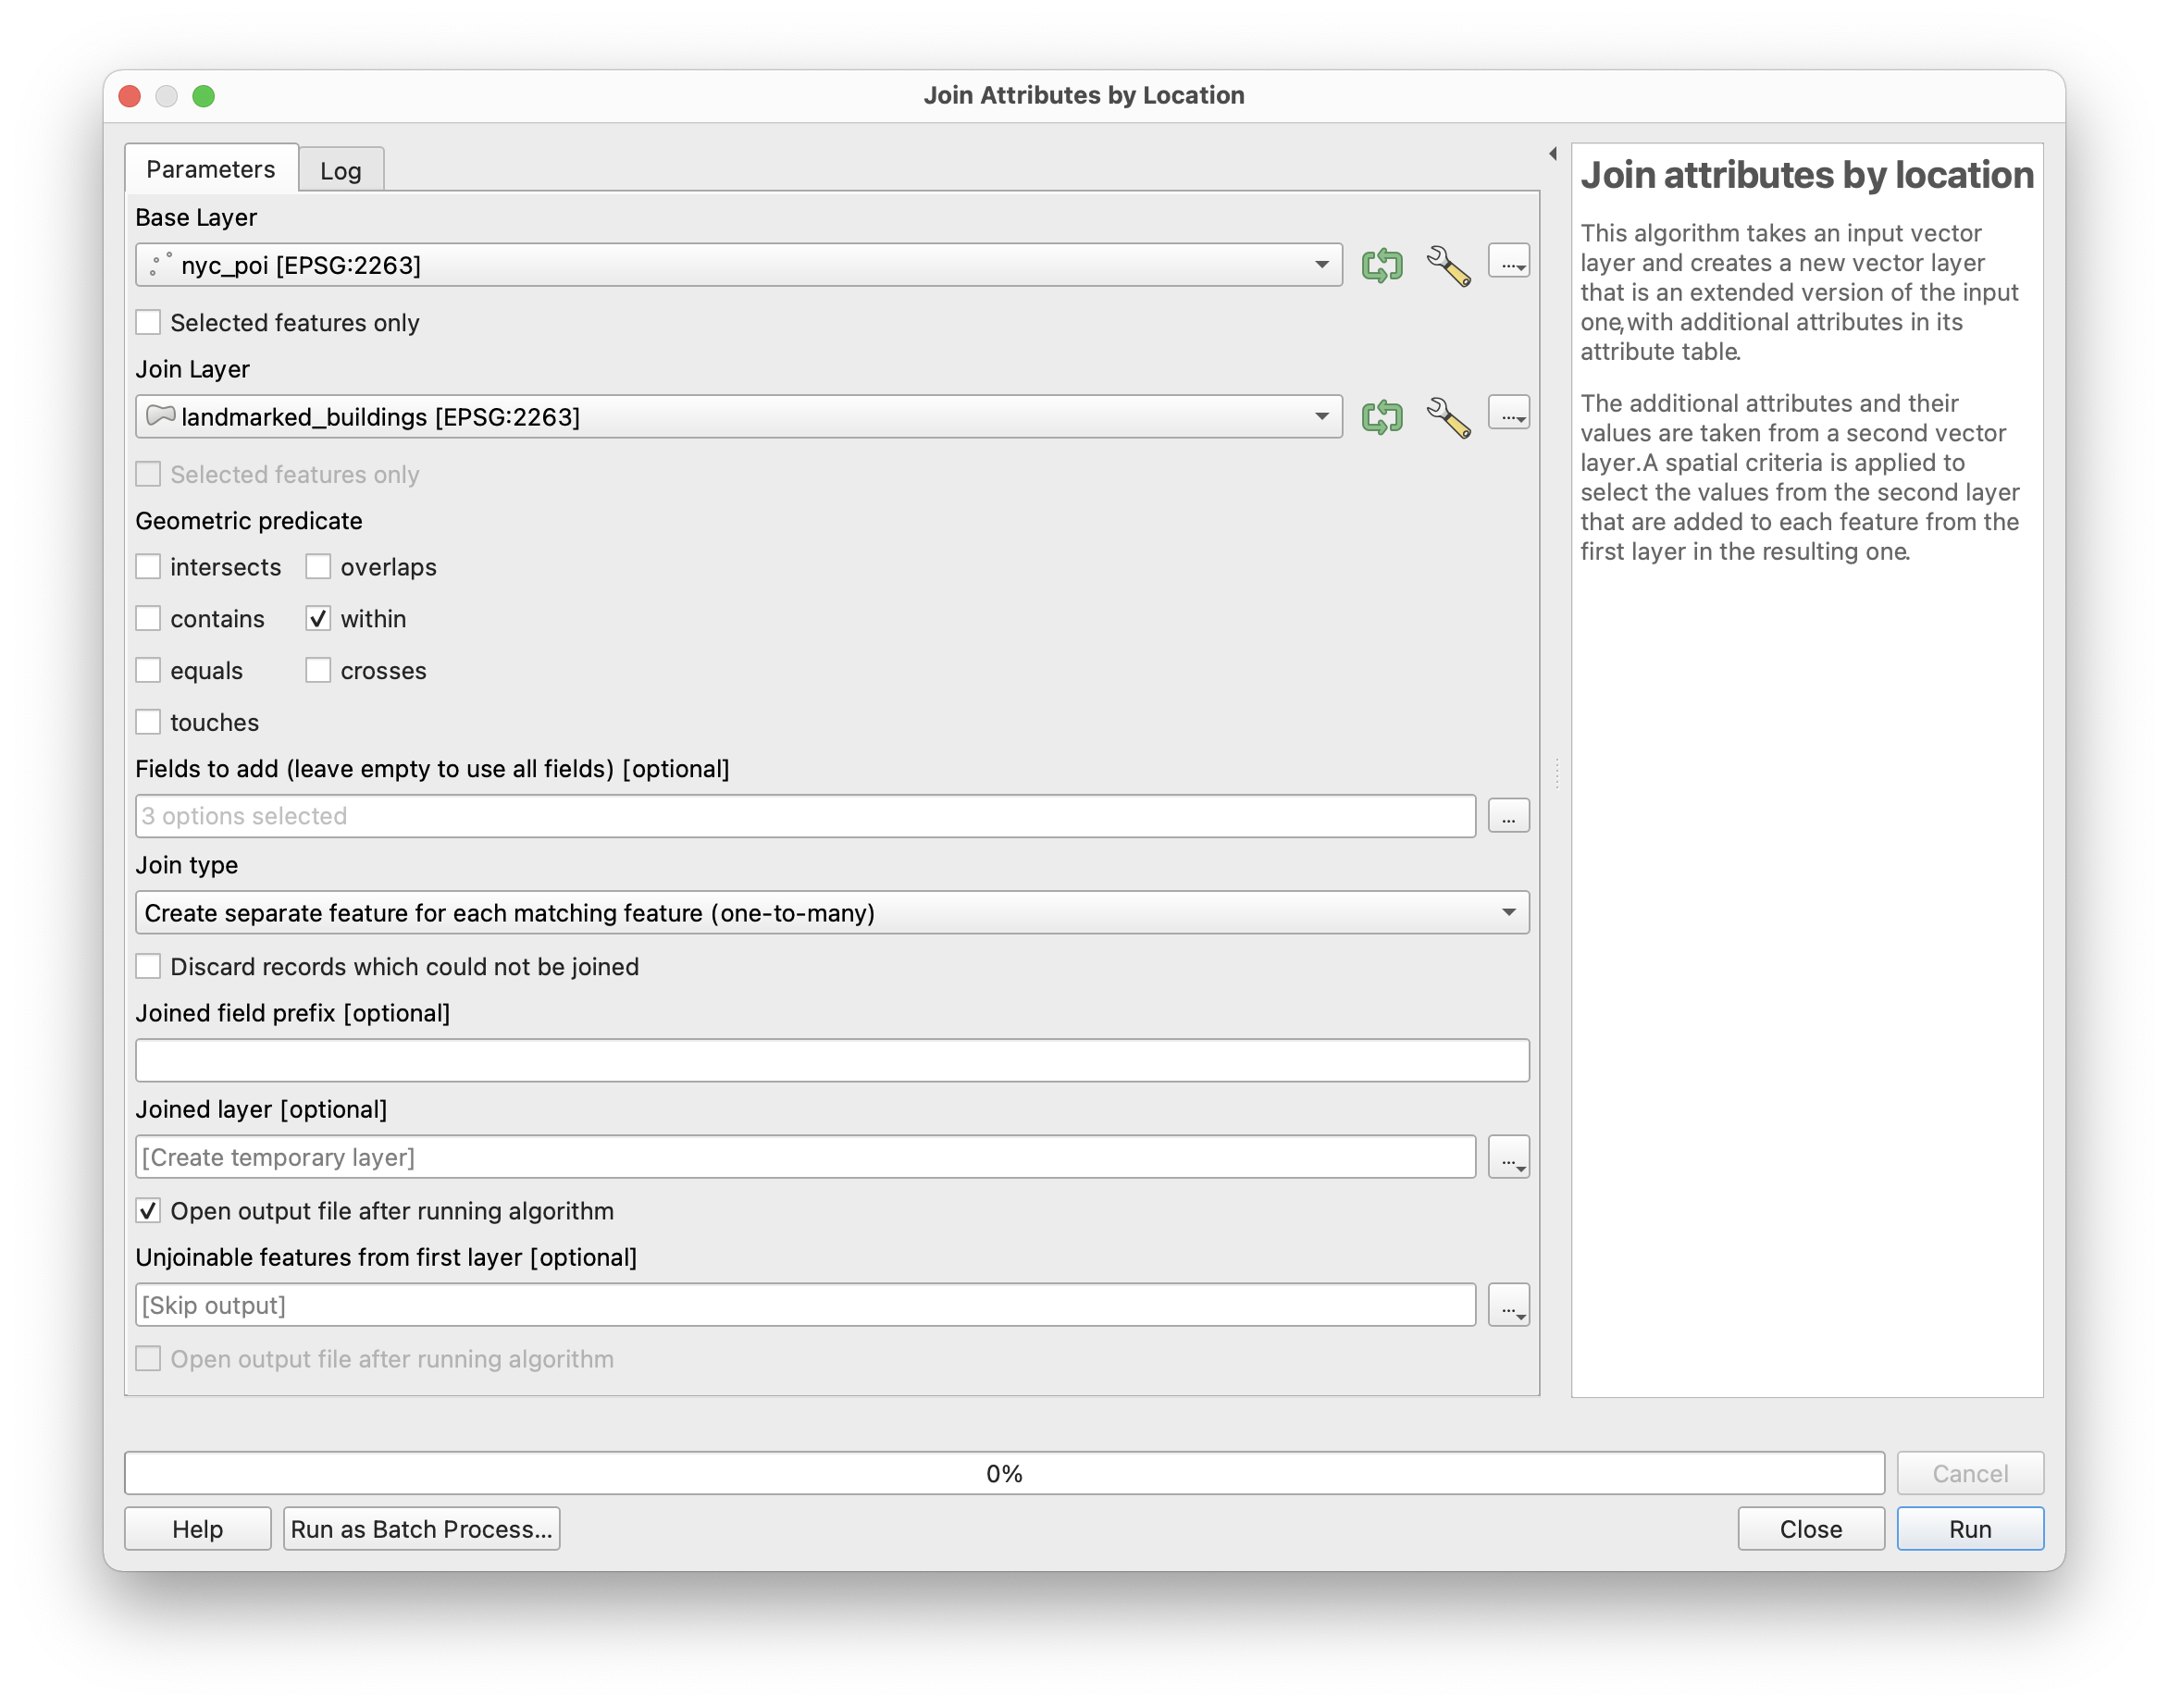
In the Fields to add option click on the ... button and then select “build_type”, “build_nme”, “circa” and any other fields from the landmarks dataset you are interested in.
Select a location to save the joined layer, and specify a file name nyc_poi_join_landmark.shp is a suggestion.
Click run. This may take several minutes to execute.
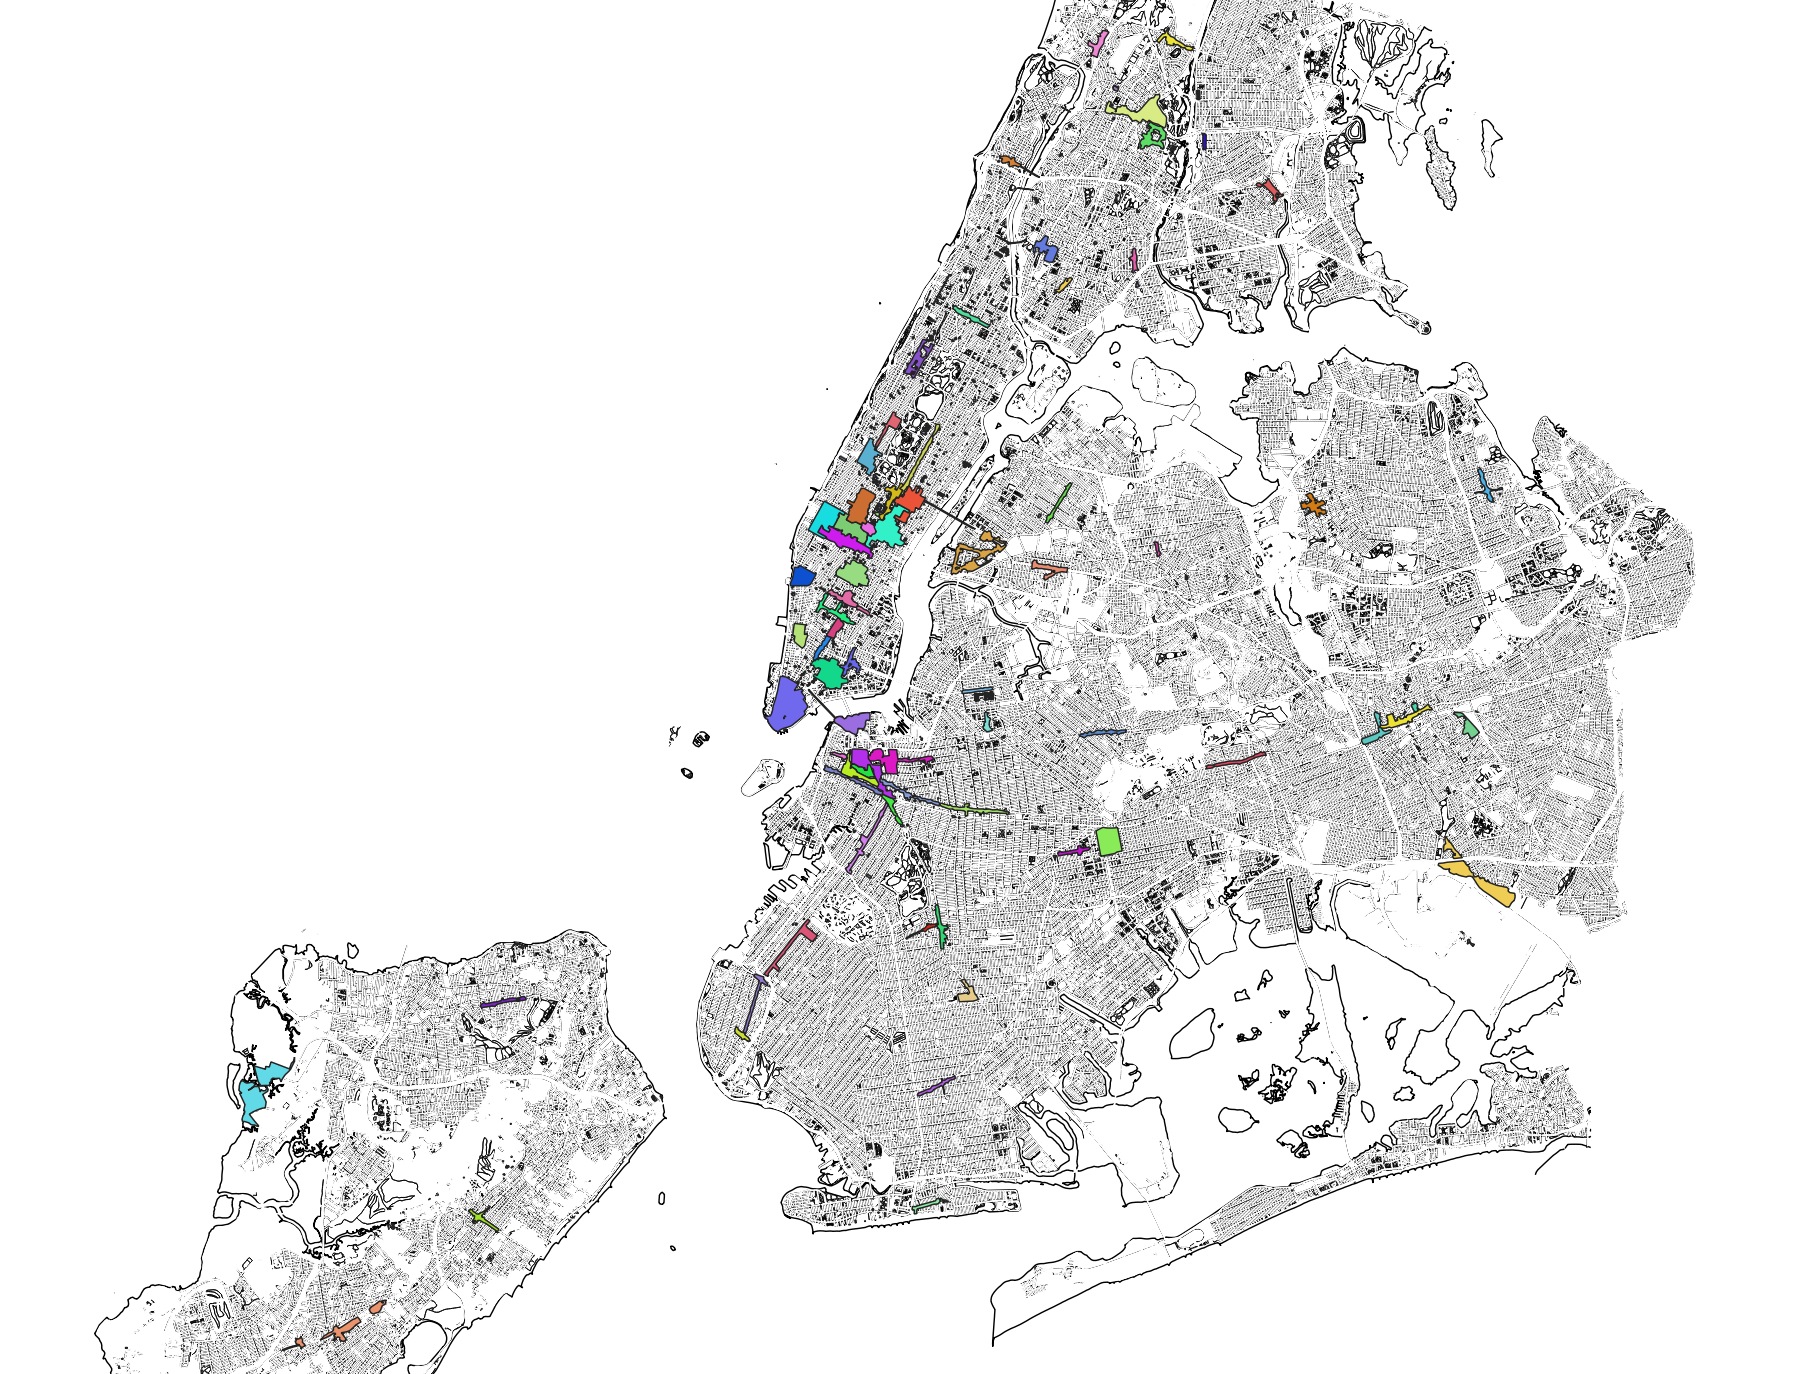
The resulting layer should be added to the layers panel on your map once it finishes processing. Open the attribute table for the nyc_poi_join_landmark layer. We expect that information from the landmarked buildings will be added to the attribute table for those points of interest that fall within a landmarked building. Sort by ‘build_nme’ field and then select all of the points of interest that have a value for this field.
Save your QGIS project.
From here you could use select by expression queries to find which points of interest are within these buildings, as well as which land marked buildings have the most points of interest within them. You could also save these selected features to create a new dataset of just those points of interest within landmark buildings.
Spatial join with summary statistics: which business improvement district has the most street trees?
Find and download a shapefile for the Business Improvement District boundaries for NYC. Available here from NYC open data, be sure to select original as the download format option.
Save the downloaded file to your data folder for this workshop. Add the shapefile to your QGIS project. Below the BIDs are symbolized by the BID name.
 Save your QGIS project.
With this question we are interested in finding out how many street trees fall within each BID and then finding the BID with the most street trees.
To answer this we will perform a spatial join, we will join information about the street trees to the BID boundaries. However because there are multiple street trees within each BID we need to summarize. Each BID is a single feature and corresponds with exactly one row in its attribute table. So in order to join information about multiple trees to each BID we must summarize that information. We could take the count, sum, mean, max, first value, last value or other standard summary method.
Here because we want to know how many trees are within each BID we will use the count method.
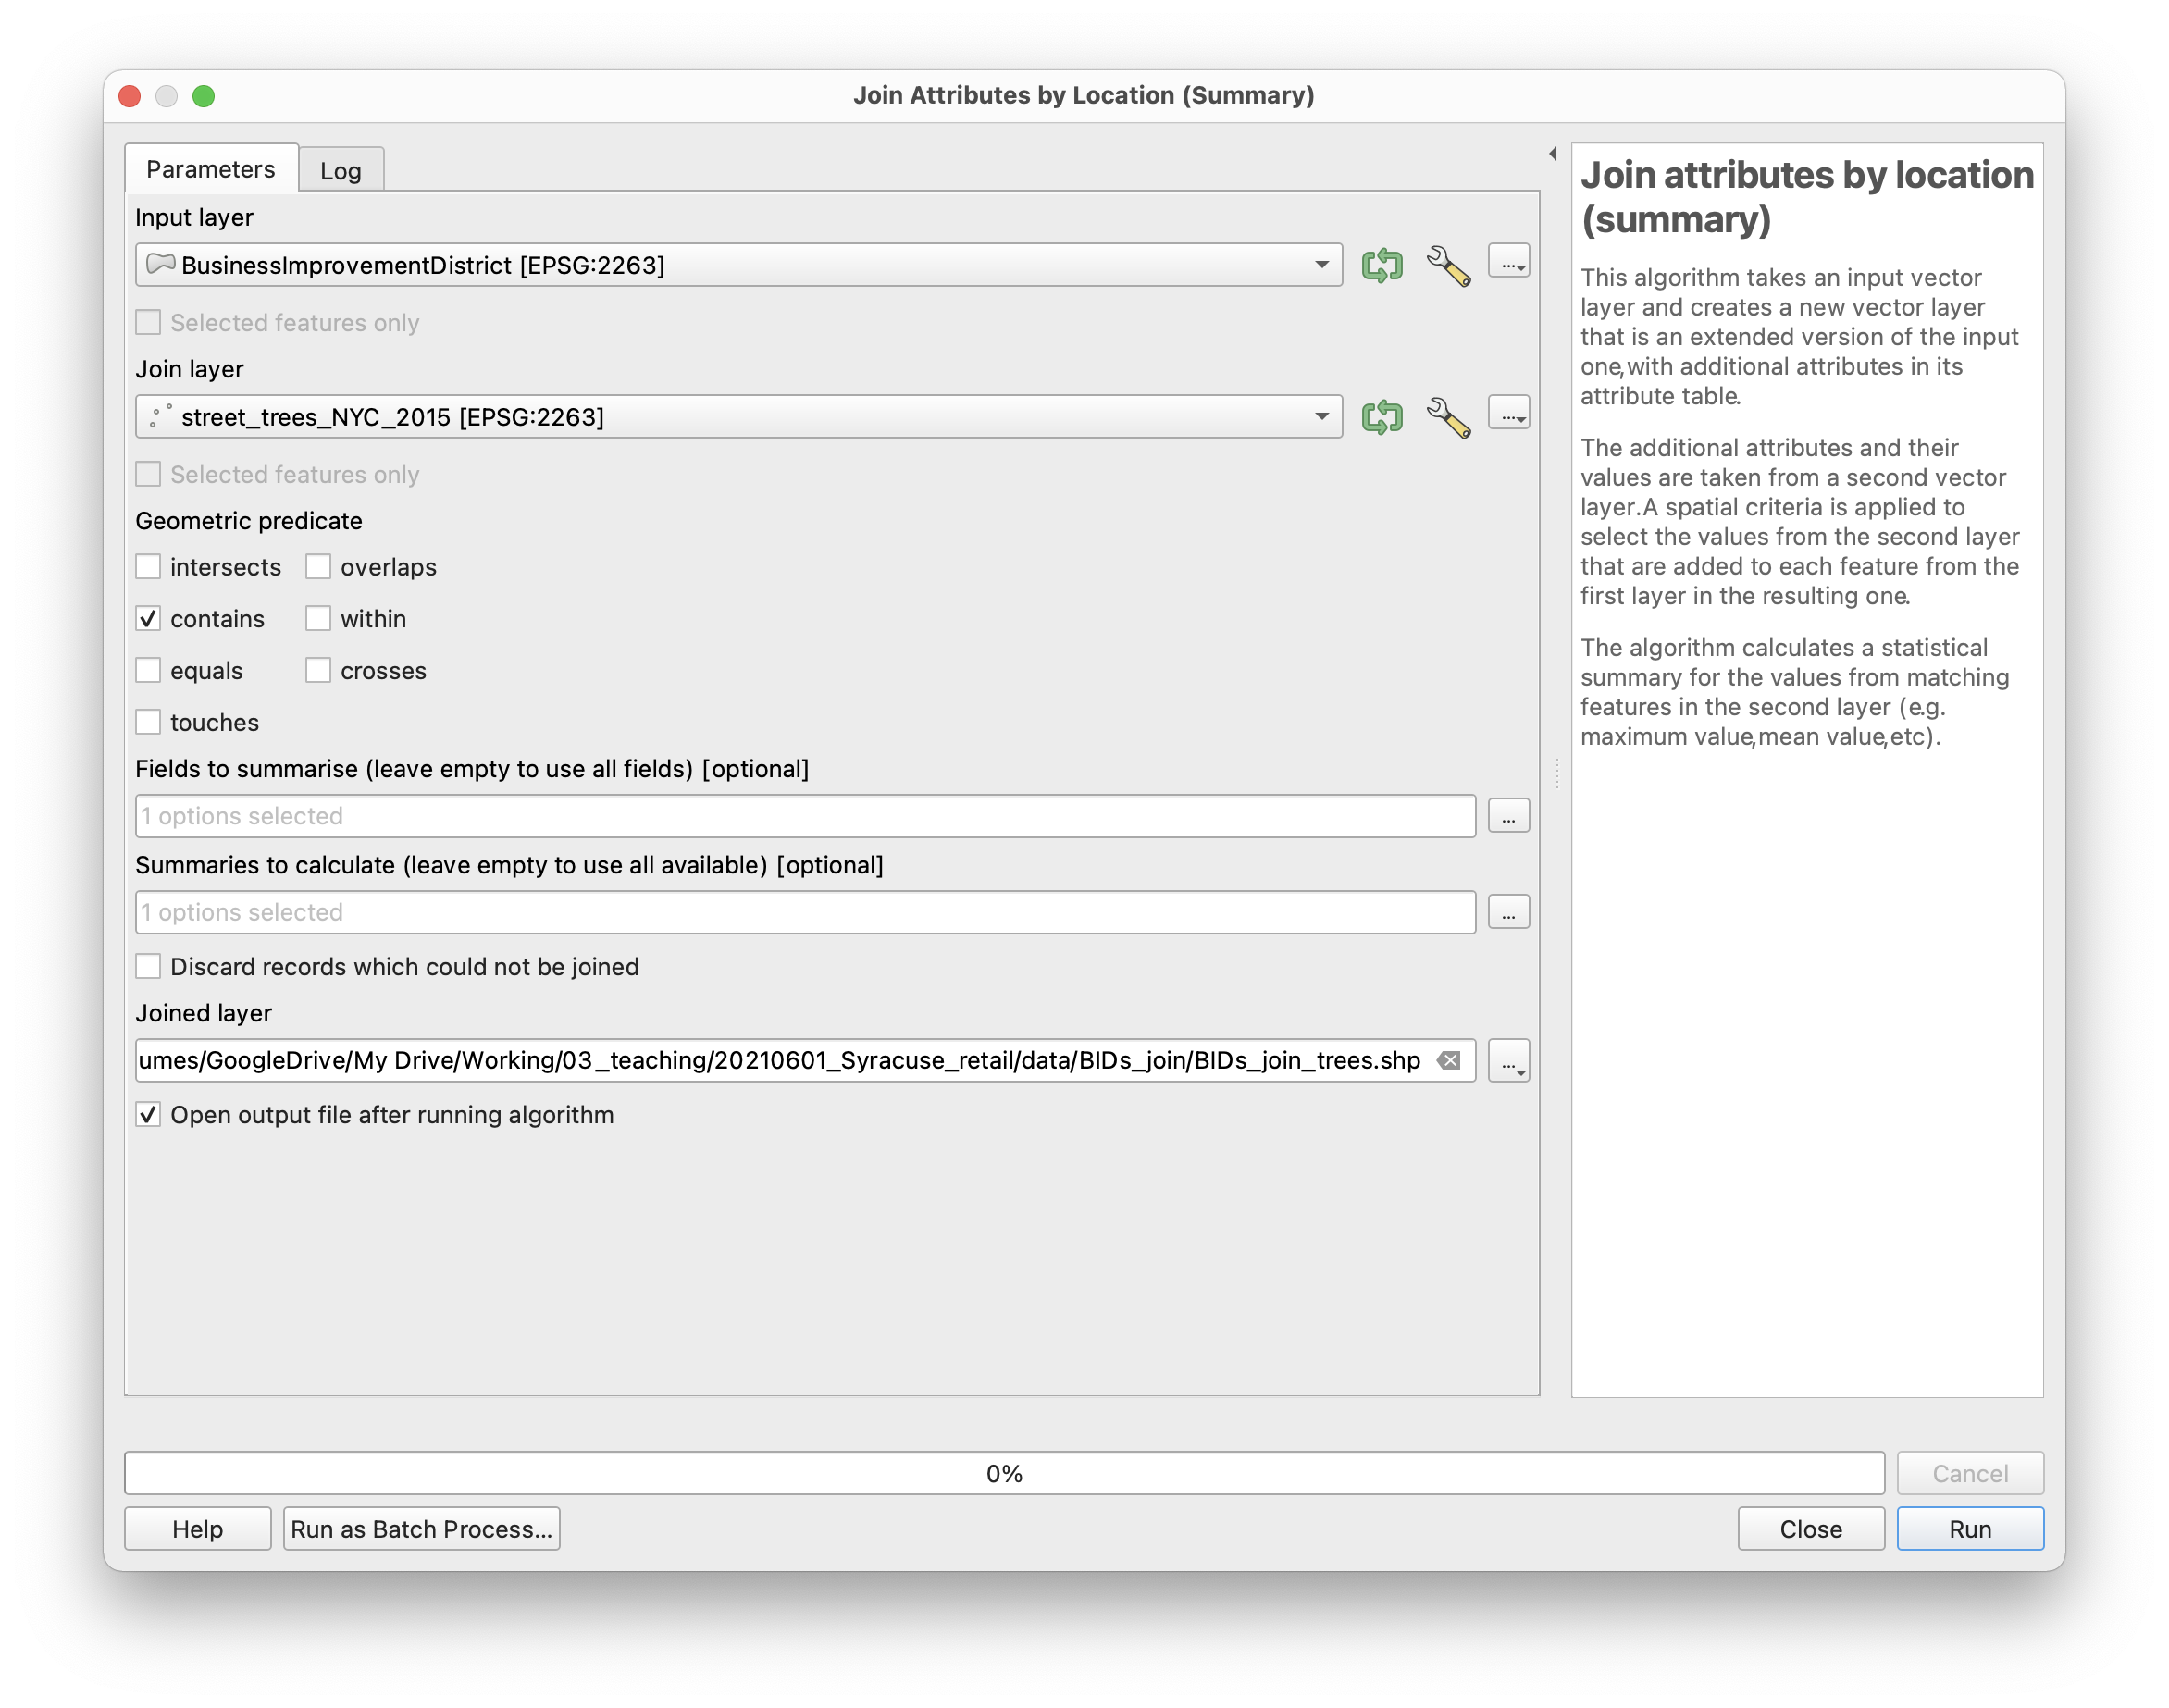
To do this in QGIS, open the Processing toolbox by selecting from the top menu Processing>Toolbox. When the toolbox opens expand the Vector general menu, and select Join attributes by location (summary). Notice that there is also a Join attributes by location tool, if performing a spatial join where each input feature corresponds with only one join feature (i.e. you do not need to summarize the join features) then use this tool.
In the dialog box which opens make the following selections.
For the fields to summarize click on the button with … to select the tree_id. Be sure to specify a location to save the results of your join:
Once you have made these selections click Run. This again may take a few minutes to complete.
Once it finishes open the attribute table for the new dataset that is the result of the join. What do you expect to see?
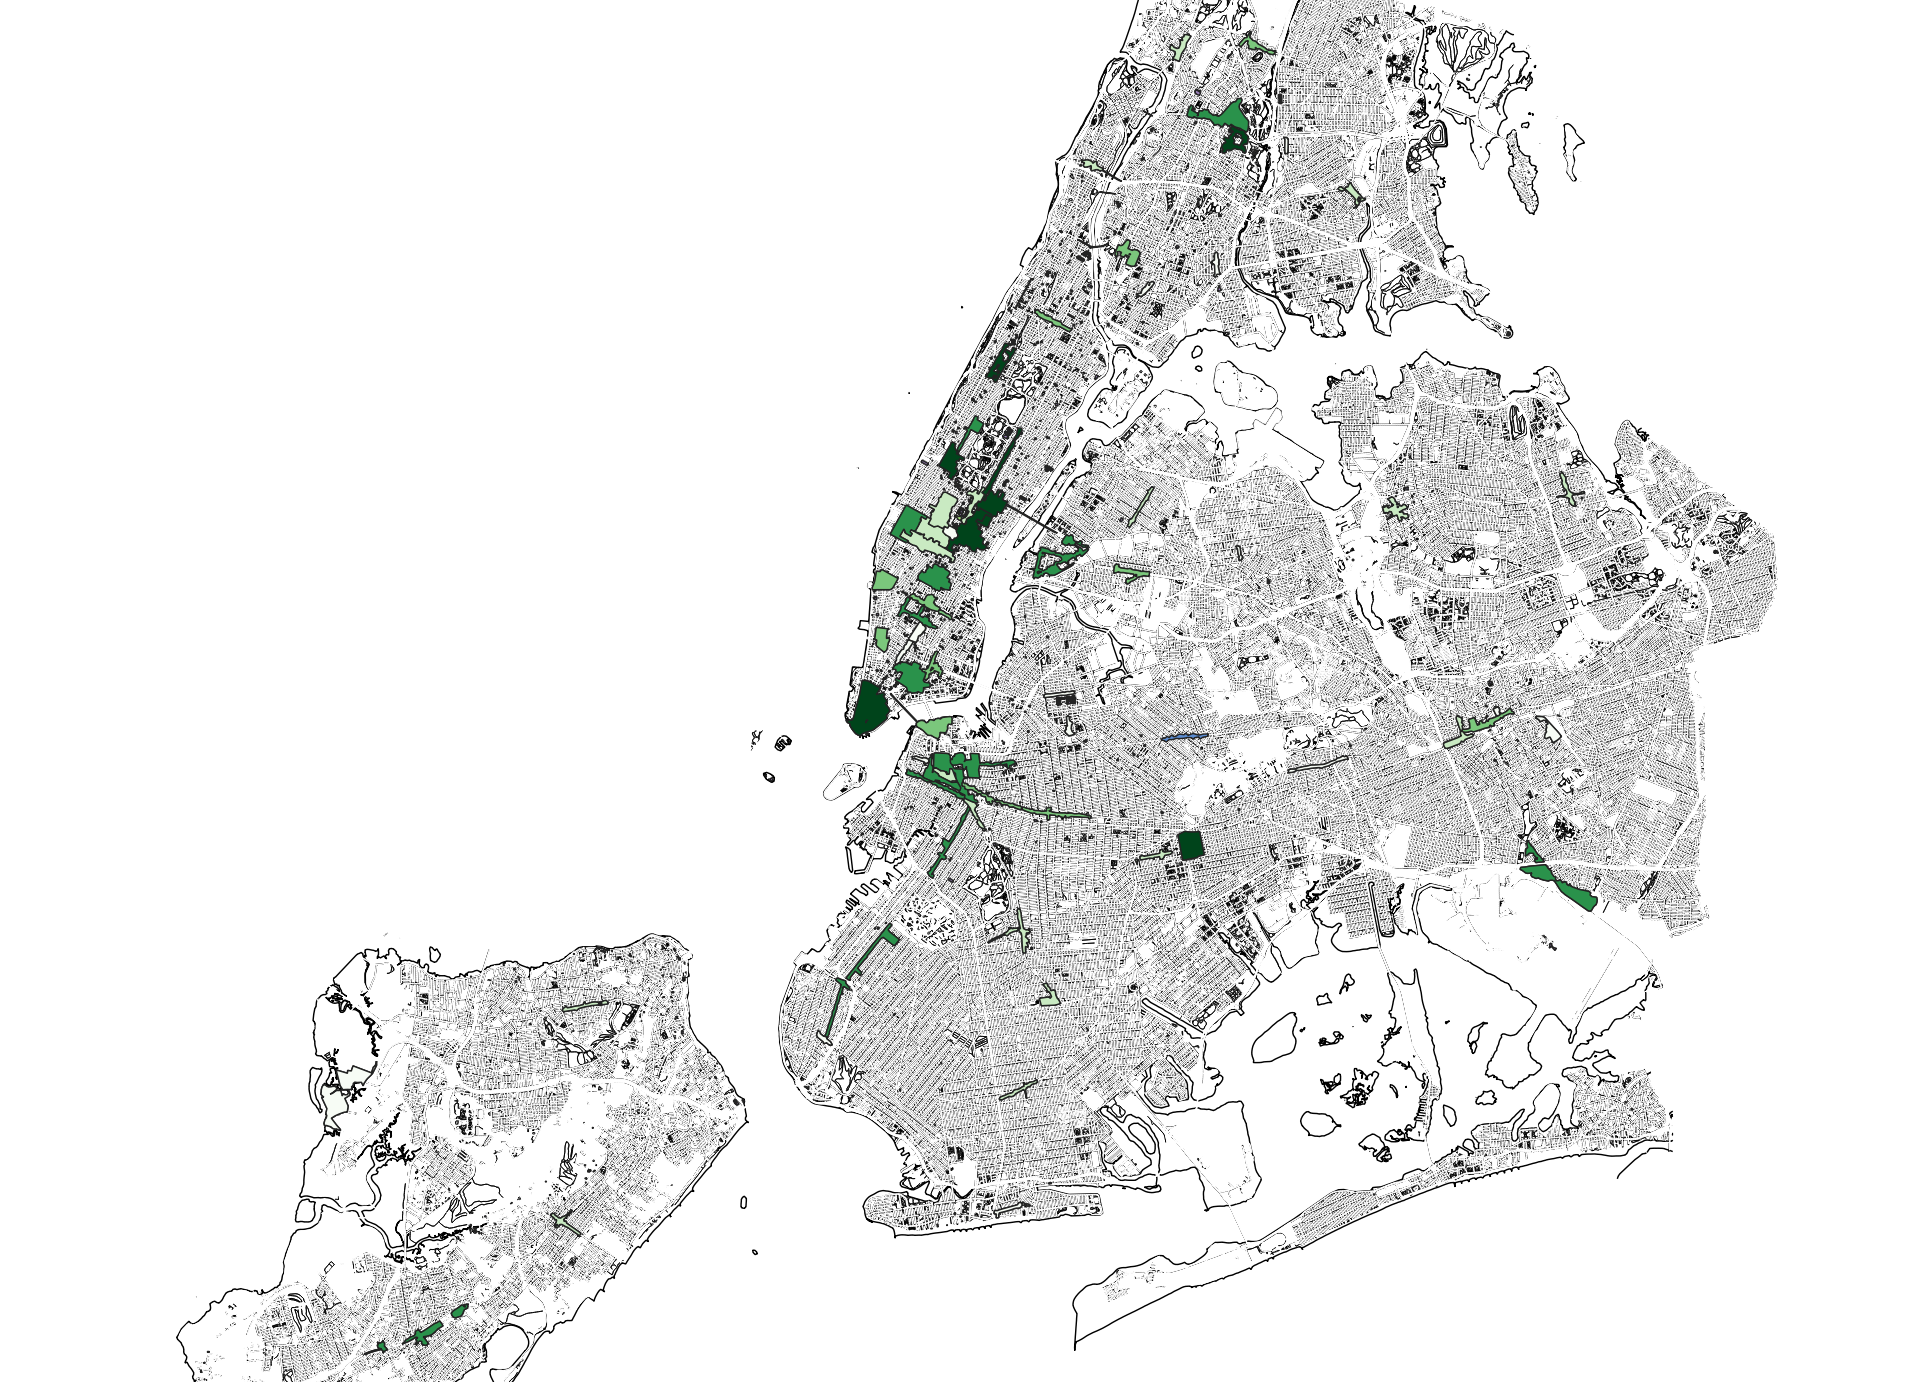
You should expect that the new dataset has the geometry of the BID boundaries (the Input layer) and that the attribute table of the original BIDs dataset now has a new column with the count of how many street trees fall within each BID boundary. Check to be sure that this is the case.
Now you can symbolize the BIDs based on how many trees they contain.
Bonus how could you refine this to show tree density?
Buffers: Which McDonald’s has the most nearby street trees?
The answer to this question can help to show which is the best spot for a casual shady outdoor snack! It also demonstrates some methods for starting to analyze personal scale aspects of the built environment across NYC.
To answer this question we need to do two things: (1) define what is ‘near’ to each McDonalds and (2) count how many trees are within that near area.
Step (2) is identical to the problem we just solved for BIDs. For step (1) we will use a new method, called a buffer to define an area that is ‘near’ to each McDonalds.
A buffer is a geometric operation that takes an input dataset and then creates a new polygonal dataset whose shape is determined by a specified offset (or buffer) distance from the original dataset.
To create buffers around each McDonalds open the Vector>Geoprocessing Tools>Buffer tool.
Make the following selections:
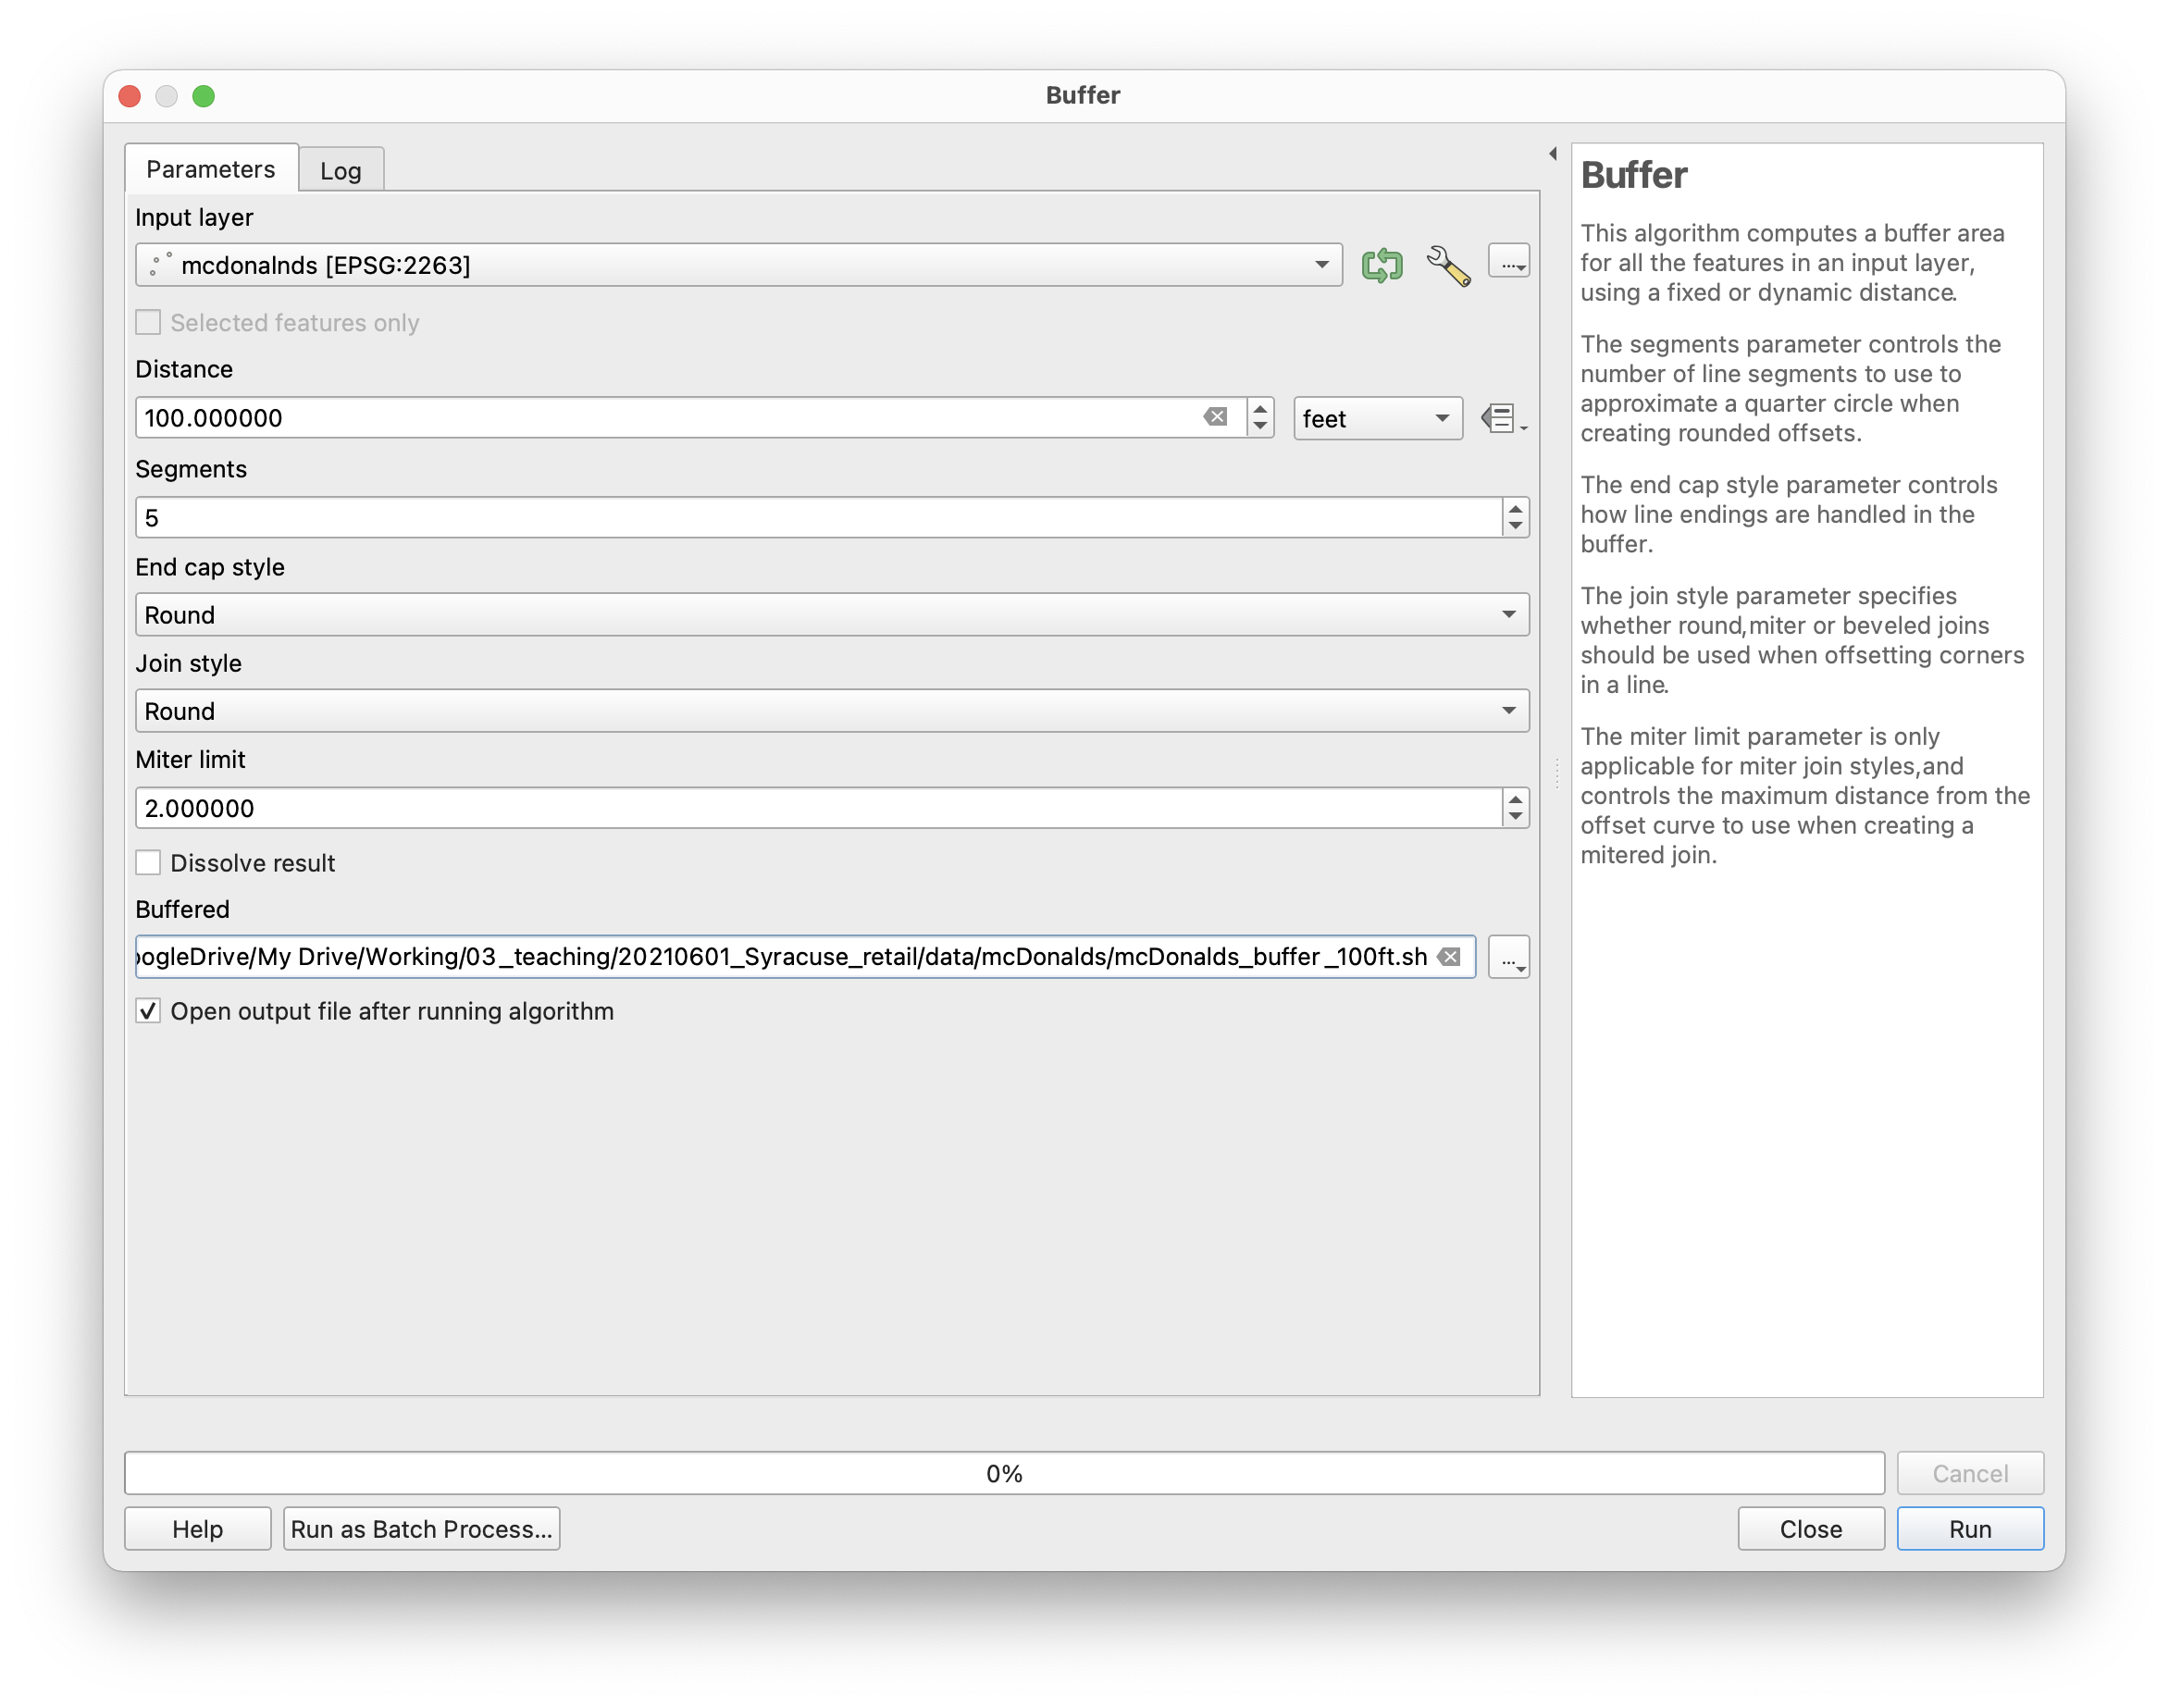
The resulting layer should look something like this, the McDonald’s locations in red are surrounded by the new 100 foot buffers we just created:
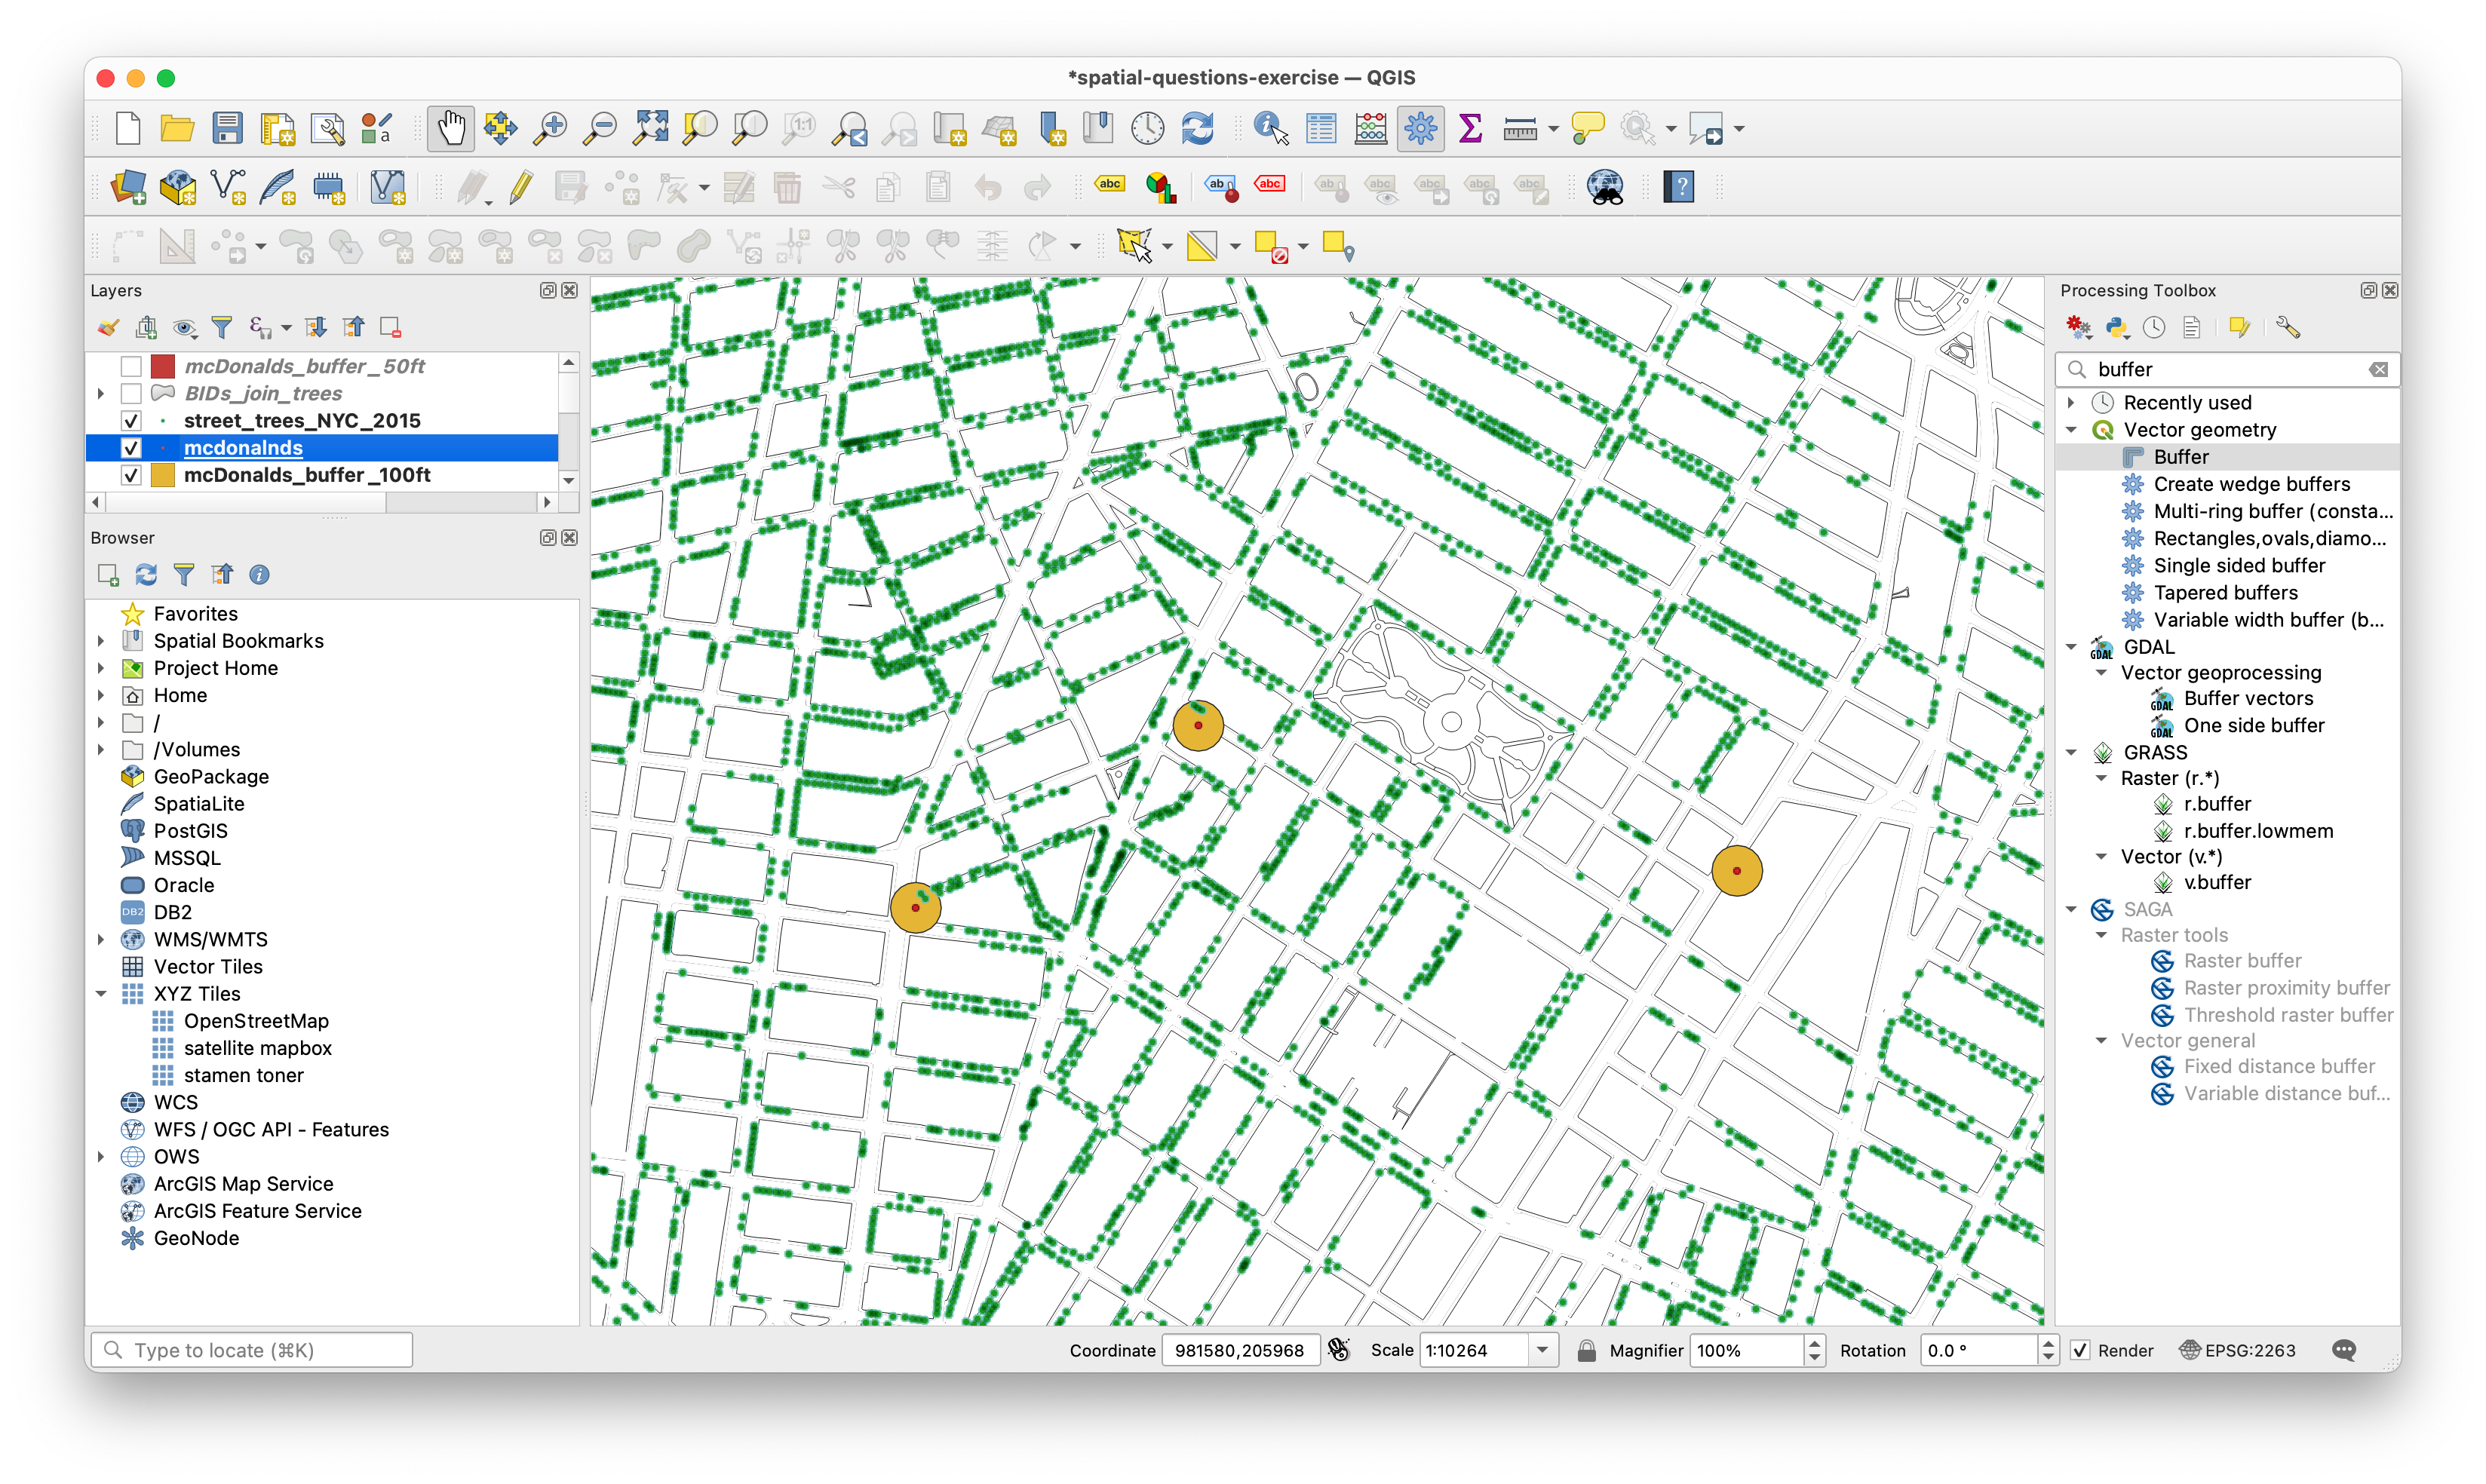
Now apply the method used for the BIDs to find which McDonald’s locations are most likely to have a shady spot outside to eat.
–